Iraqi vs Belgian Median Family Income
COMPARE
Iraqi
Belgian
Median Family Income
Median Family Income Comparison
Iraqis
Belgians
$100,658
MEDIAN FAMILY INCOME
26.3/ 100
METRIC RATING
193rd/ 347
METRIC RANK
$102,788
MEDIAN FAMILY INCOME
51.4/ 100
METRIC RATING
173rd/ 347
METRIC RANK
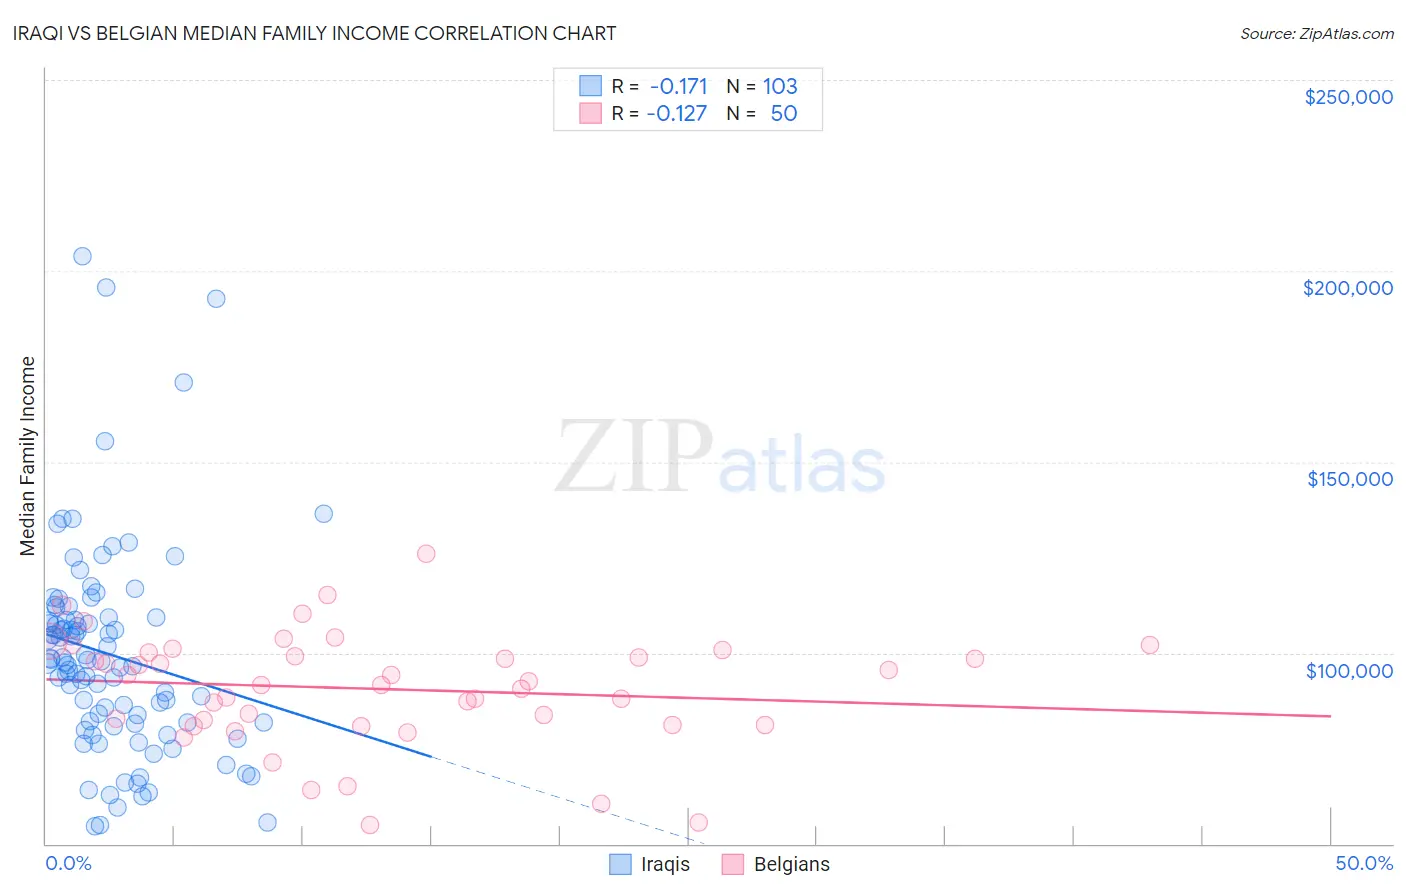
Iraqi vs Belgian Median Family Income Correlation Chart
The statistical analysis conducted on geographies consisting of 170,585,790 people shows a poor negative correlation between the proportion of Iraqis and median family income in the United States with a correlation coefficient (R) of -0.171 and weighted average of $100,658. Similarly, the statistical analysis conducted on geographies consisting of 355,758,296 people shows a poor negative correlation between the proportion of Belgians and median family income in the United States with a correlation coefficient (R) of -0.127 and weighted average of $102,788, a difference of 2.1%.
Median Family Income Correlation Summary
| Measurement | Iraqi | Belgian |
| Minimum | $54,690 | $55,000 |
| Maximum | $203,844 | $126,094 |
| Range | $149,154 | $71,094 |
| Mean | $99,589 | $90,563 |
| Median | $97,704 | $92,069 |
| Interquartile 25% (IQ1) | $81,823 | $81,250 |
| Interquartile 75% (IQ3) | $109,149 | $100,134 |
| Interquartile Range (IQR) | $27,326 | $18,884 |
| Standard Deviation (Sample) | $27,377 | $14,839 |
| Standard Deviation (Population) | $27,244 | $14,690 |
Demographics Similar to Iraqis and Belgians by Median Family Income
In terms of median family income, the demographic groups most similar to Iraqis are Immigrants from Kenya ($100,679, a difference of 0.020%), Colombian ($100,750, a difference of 0.090%), Immigrants ($100,962, a difference of 0.30%), Immigrants from Portugal ($100,984, a difference of 0.32%), and Guamanian/Chamorro ($101,061, a difference of 0.40%). Similarly, the demographic groups most similar to Belgians are Finnish ($102,676, a difference of 0.11%), Immigrants from Eastern Africa ($102,451, a difference of 0.33%), French ($102,368, a difference of 0.41%), German ($102,254, a difference of 0.52%), and Welsh ($102,151, a difference of 0.62%).
| Demographics | Rating | Rank | Median Family Income |
| Belgians | 51.4 /100 | #173 | Average $102,788 |
| Finns | 50.0 /100 | #174 | Average $102,676 |
| Immigrants | Eastern Africa | 47.1 /100 | #175 | Average $102,451 |
| French | 46.1 /100 | #176 | Average $102,368 |
| Germans | 44.6 /100 | #177 | Average $102,254 |
| Welsh | 43.3 /100 | #178 | Average $102,151 |
| South Americans | 39.7 /100 | #179 | Fair $101,856 |
| French Canadians | 37.0 /100 | #180 | Fair $101,634 |
| Spaniards | 36.8 /100 | #181 | Fair $101,617 |
| Tsimshian | 35.9 /100 | #182 | Fair $101,543 |
| Kenyans | 34.5 /100 | #183 | Fair $101,417 |
| Immigrants | Costa Rica | 33.7 /100 | #184 | Fair $101,354 |
| Dutch | 31.9 /100 | #185 | Fair $101,192 |
| Celtics | 31.3 /100 | #186 | Fair $101,139 |
| Tlingit-Haida | 30.8 /100 | #187 | Fair $101,092 |
| Guamanians/Chamorros | 30.5 /100 | #188 | Fair $101,061 |
| Immigrants | Portugal | 29.6 /100 | #189 | Fair $100,984 |
| Immigrants | Immigrants | 29.4 /100 | #190 | Fair $100,962 |
| Colombians | 27.2 /100 | #191 | Fair $100,750 |
| Immigrants | Kenya | 26.5 /100 | #192 | Fair $100,679 |
| Iraqis | 26.3 /100 | #193 | Fair $100,658 |