Iraqi vs Immigrants from Afghanistan Median Family Income
COMPARE
Iraqi
Immigrants from Afghanistan
Median Family Income
Median Family Income Comparison
Iraqis
Immigrants from Afghanistan
$100,658
MEDIAN FAMILY INCOME
26.3/ 100
METRIC RATING
193rd/ 347
METRIC RANK
$108,709
MEDIAN FAMILY INCOME
95.6/ 100
METRIC RATING
109th/ 347
METRIC RANK
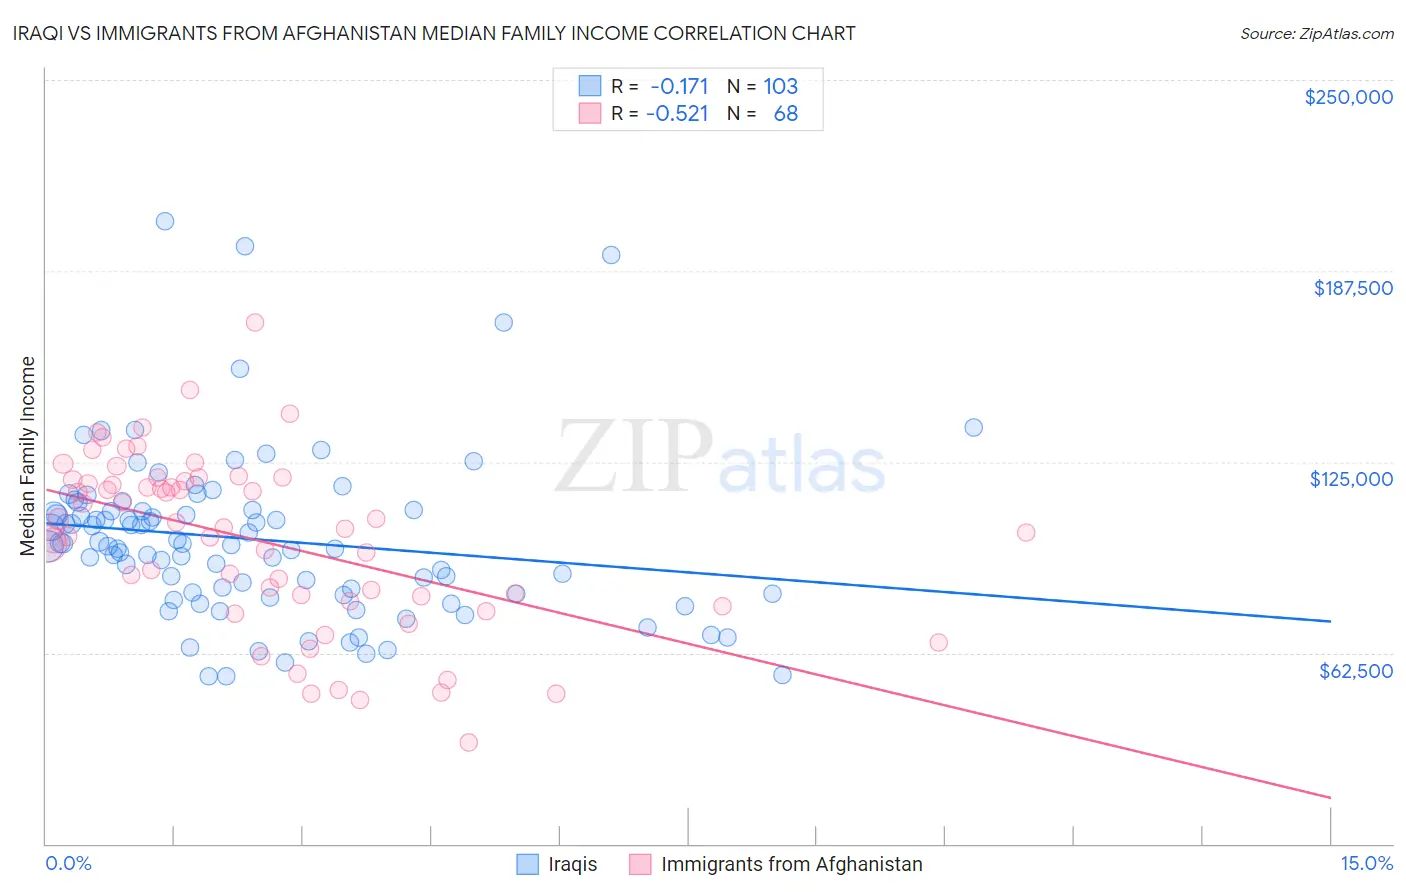
Iraqi vs Immigrants from Afghanistan Median Family Income Correlation Chart
The statistical analysis conducted on geographies consisting of 170,585,790 people shows a poor negative correlation between the proportion of Iraqis and median family income in the United States with a correlation coefficient (R) of -0.171 and weighted average of $100,658. Similarly, the statistical analysis conducted on geographies consisting of 147,629,265 people shows a substantial negative correlation between the proportion of Immigrants from Afghanistan and median family income in the United States with a correlation coefficient (R) of -0.521 and weighted average of $108,709, a difference of 8.0%.
Median Family Income Correlation Summary
| Measurement | Iraqi | Immigrants from Afghanistan |
| Minimum | $54,690 | $33,250 |
| Maximum | $203,844 | $170,486 |
| Range | $149,154 | $137,236 |
| Mean | $99,589 | $99,044 |
| Median | $97,704 | $103,312 |
| Interquartile 25% (IQ1) | $81,823 | $80,208 |
| Interquartile 75% (IQ3) | $109,149 | $118,974 |
| Interquartile Range (IQR) | $27,326 | $38,766 |
| Standard Deviation (Sample) | $27,377 | $28,337 |
| Standard Deviation (Population) | $27,244 | $28,128 |
Similar Demographics by Median Family Income
Demographics Similar to Iraqis by Median Family Income
In terms of median family income, the demographic groups most similar to Iraqis are Uruguayan ($100,656, a difference of 0.0%), Immigrants from Kenya ($100,679, a difference of 0.020%), Colombian ($100,750, a difference of 0.090%), Immigrants from South America ($100,414, a difference of 0.24%), and Immigrants ($100,962, a difference of 0.30%).
| Demographics | Rating | Rank | Median Family Income |
| Celtics | 31.3 /100 | #186 | Fair $101,139 |
| Tlingit-Haida | 30.8 /100 | #187 | Fair $101,092 |
| Guamanians/Chamorros | 30.5 /100 | #188 | Fair $101,061 |
| Immigrants | Portugal | 29.6 /100 | #189 | Fair $100,984 |
| Immigrants | Immigrants | 29.4 /100 | #190 | Fair $100,962 |
| Colombians | 27.2 /100 | #191 | Fair $100,750 |
| Immigrants | Kenya | 26.5 /100 | #192 | Fair $100,679 |
| Iraqis | 26.3 /100 | #193 | Fair $100,658 |
| Uruguayans | 26.3 /100 | #194 | Fair $100,656 |
| Immigrants | South America | 23.9 /100 | #195 | Fair $100,414 |
| Samoans | 23.3 /100 | #196 | Fair $100,344 |
| Immigrants | Cameroon | 22.8 /100 | #197 | Fair $100,289 |
| Immigrants | Africa | 22.5 /100 | #198 | Fair $100,256 |
| Yugoslavians | 21.3 /100 | #199 | Fair $100,119 |
| Spanish | 20.1 /100 | #200 | Fair $99,977 |
Demographics Similar to Immigrants from Afghanistan by Median Family Income
In terms of median family income, the demographic groups most similar to Immigrants from Afghanistan are British ($108,705, a difference of 0.0%), Immigrants from Western Asia ($108,691, a difference of 0.020%), Immigrants from Zimbabwe ($108,830, a difference of 0.11%), Immigrants from Poland ($108,570, a difference of 0.13%), and Immigrants from Saudi Arabia ($108,544, a difference of 0.15%).
| Demographics | Rating | Rank | Median Family Income |
| Assyrians/Chaldeans/Syriacs | 97.2 /100 | #102 | Exceptional $109,622 |
| Immigrants | Brazil | 96.9 /100 | #103 | Exceptional $109,418 |
| Palestinians | 96.9 /100 | #104 | Exceptional $109,413 |
| Syrians | 96.7 /100 | #105 | Exceptional $109,299 |
| Albanians | 96.4 /100 | #106 | Exceptional $109,136 |
| Immigrants | North Macedonia | 96.4 /100 | #107 | Exceptional $109,136 |
| Immigrants | Zimbabwe | 95.9 /100 | #108 | Exceptional $108,830 |
| Immigrants | Afghanistan | 95.6 /100 | #109 | Exceptional $108,709 |
| British | 95.6 /100 | #110 | Exceptional $108,705 |
| Immigrants | Western Asia | 95.6 /100 | #111 | Exceptional $108,691 |
| Immigrants | Poland | 95.3 /100 | #112 | Exceptional $108,570 |
| Immigrants | Saudi Arabia | 95.2 /100 | #113 | Exceptional $108,544 |
| Poles | 95.2 /100 | #114 | Exceptional $108,507 |
| Swedes | 95.1 /100 | #115 | Exceptional $108,499 |
| Chileans | 95.0 /100 | #116 | Exceptional $108,429 |