Slavic vs Immigrants from Eritrea Median Family Income

COMPARE

Slavic
Race
Ancestry
AfghanAfricanAlaska NativeAlaskan AthabascanAlbanianAleutAlsatianAmericanApacheArabArapahoArgentineanArmenianAssyrian/Chaldean/SyriacAustralianAustrianBahamianBangladeshiBarbadianBasqueBelgianBelizeanBermudanBhutaneseBlackfeetBolivianBrazilianBritishBritish West IndianBulgarianBurmeseCajunCambodianCanadianCape VerdeanCarpatho RusynCelticCentral AmericanCentral American IndianCherokeeCheyenneChickasawChileanChineseChippewaChoctawColombianColvilleComancheCosta RicanCreeCreekCroatianCrowCubanCypriotCzechCzechoslovakianDanishDelawareDominicanDutchDutch West IndianEastern EuropeanEcuadorianEgyptianEnglishEstonianEthiopianEuropeanFijianFilipinoFinnishFrenchFrench American IndianFrench CanadianGermanGerman RussianGhanaianGreekGuamanian/ChamorroGuatemalanGuyaneseHaitianHmongHonduranHopiHoumaHungarianIcelanderIndian (Asian)IndonesianInupiatIranianIraqiIrishIroquoisIsraeliItalianJamaicanJapaneseJordanianKenyanKiowaKoreanLaotianLatvianLebaneseLiberianLithuanianLumbeeLuxembourgerMacedonianMalaysianMalteseMarshalleseMenomineeMexicanMexican American IndianMongolianMoroccanNative HawaiianNavajoNepaleseNew ZealanderNicaraguanNigerianNorthern EuropeanNorwegianOkinawanOsageOttawaPaiutePakistaniPalestinianPanamanianParaguayanPennsylvania GermanPeruvianPimaPolishPortuguesePotawatomiPuebloPuerto RicanPuget Sound SalishRomanianRussianSalvadoranSamoanScandinavianScotch-IrishScottishSeminoleSenegaleseSerbianShoshoneSierra LeoneanSiouxSlavicSlovakSloveneSomaliSouth AfricanSouth AmericanSouth American IndianSoviet UnionSpaniardSpanishSpanish AmericanSpanish American IndianSri LankanSubsaharan AfricanSudaneseSwedishSwissSyrianTaiwaneseThaiTlingit-HaidaTohono O'OdhamTonganTrinidadian and TobagonianTsimshianTurkishU.S. Virgin IslanderUgandanUkrainianUruguayanUteVenezuelanVietnameseWelshWest IndianYakamaYaquiYugoslavianYumanYup'ikZimbabwean
Immigration
NonimmigrantsImmigrantsAfghanistanAfricaAlbaniaArgentinaArmeniaAsiaAustraliaAustriaBahamasBangladeshBarbadosBelarusBelgiumBelizeBoliviaBosnia and HerzegovinaBrazilBulgariaBurma/MyanmarCabo VerdeCambodiaCameroonCanadaCaribbeanCentral AmericaChileChinaColombiaCongoCosta RicaCroatiaCubaCzechoslovakiaDenmarkDominicaDominican RepublicEastern AfricaEastern AsiaEastern EuropeEcuadorEgyptEl SalvadorEnglandEthiopiaEuropeFijiFranceGermanyGhanaGreeceGrenadaGuatemalaGuyanaHaitiHondurasHong KongHungaryIndiaIndonesiaIranIraqIrelandIsraelItalyJamaicaJapanJordanKazakhstanKenyaKoreaKuwaitLaosLatin AmericaLatviaLebanonLiberiaLithuaniaMalaysiaMexicoMicronesiaMiddle AfricaMoldovaMoroccoNepalNetherlandsNicaraguaNigeriaNorth AmericaNorth MacedoniaNorthern AfricaNorthern EuropeNorwayOceaniaPakistanPanamaPeruPhilippinesPolandPortugalRomaniaRussiaSaudi ArabiaScotlandSenegalSerbiaSierra LeoneSingaporeSomaliaSouth AfricaSouth AmericaSouth Central AsiaSouth Eastern AsiaSouthern EuropeSpainSri LankaSt. Vincent and the GrenadinesSudanSwedenSwitzerlandSyriaTaiwanThailandTrinidad and TobagoTurkeyUgandaUkraineUruguayUzbekistanVenezuelaVietnamWest IndiesWestern AfricaWestern AsiaWestern EuropeYemenZaireZimbabweAzores
Immigrants from Eritrea
Race
Ancestry
AfghanAfricanAlaska NativeAlaskan AthabascanAlbanianAleutAlsatianAmericanApacheArabArapahoArgentineanArmenianAssyrian/Chaldean/SyriacAustralianAustrianBahamianBangladeshiBarbadianBasqueBelgianBelizeanBermudanBhutaneseBlackfeetBolivianBrazilianBritishBritish West IndianBulgarianBurmeseCajunCambodianCanadianCape VerdeanCarpatho RusynCelticCentral AmericanCentral American IndianCherokeeCheyenneChickasawChileanChineseChippewaChoctawColombianColvilleComancheCosta RicanCreeCreekCroatianCrowCubanCypriotCzechCzechoslovakianDanishDelawareDominicanDutchDutch West IndianEastern EuropeanEcuadorianEgyptianEnglishEstonianEthiopianEuropeanFijianFilipinoFinnishFrenchFrench American IndianFrench CanadianGermanGerman RussianGhanaianGreekGuamanian/ChamorroGuatemalanGuyaneseHaitianHmongHonduranHopiHoumaHungarianIcelanderIndian (Asian)IndonesianInupiatIranianIraqiIrishIroquoisIsraeliItalianJamaicanJapaneseJordanianKenyanKiowaKoreanLaotianLatvianLebaneseLiberianLithuanianLumbeeLuxembourgerMacedonianMalaysianMalteseMarshalleseMenomineeMexicanMexican American IndianMongolianMoroccanNative HawaiianNavajoNepaleseNew ZealanderNicaraguanNigerianNorthern EuropeanNorwegianOkinawanOsageOttawaPaiutePakistaniPalestinianPanamanianParaguayanPennsylvania GermanPeruvianPimaPolishPortuguesePotawatomiPuebloPuerto RicanPuget Sound SalishRomanianRussianSalvadoranSamoanScandinavianScotch-IrishScottishSeminoleSenegaleseSerbianShoshoneSierra LeoneanSiouxSlovakSloveneSomaliSouth AfricanSouth AmericanSouth American IndianSoviet UnionSpaniardSpanishSpanish AmericanSpanish American IndianSri LankanSubsaharan AfricanSudaneseSwedishSwissSyrianTaiwaneseThaiTlingit-HaidaTohono O'OdhamTonganTrinidadian and TobagonianTsimshianTurkishU.S. Virgin IslanderUgandanUkrainianUruguayanUteVenezuelanVietnameseWelshWest IndianYakamaYaquiYugoslavianYumanYup'ikZimbabwean
Immigration
NonimmigrantsImmigrantsAfghanistanAfricaAlbaniaArgentinaArmeniaAsiaAustraliaAustriaBahamasBangladeshBarbadosBelarusBelgiumBelizeBoliviaBosnia and HerzegovinaBrazilBulgariaBurma/MyanmarCabo VerdeCambodiaCameroonCanadaCaribbeanCentral AmericaChileChinaColombiaCongoCosta RicaCroatiaCubaCzechoslovakiaDenmarkDominicaDominican RepublicEastern AfricaEastern AsiaEastern EuropeEcuadorEgyptEl SalvadorEnglandEritreaEthiopiaEuropeFijiFranceGermanyGhanaGreeceGrenadaGuatemalaGuyanaHaitiHondurasHong KongHungaryIndiaIndonesiaIranIraqIrelandIsraelItalyJamaicaJapanJordanKazakhstanKenyaKoreaKuwaitLaosLatin AmericaLatviaLebanonLiberiaLithuaniaMalaysiaMexicoMicronesiaMiddle AfricaMoldovaMoroccoNepalNetherlandsNicaraguaNigeriaNorth AmericaNorth MacedoniaNorthern AfricaNorthern EuropeNorwayOceaniaPakistanPanamaPeruPhilippinesPolandPortugalRomaniaRussiaSaudi ArabiaScotlandSenegalSerbiaSierra LeoneSingaporeSomaliaSouth AfricaSouth AmericaSouth Central AsiaSouth Eastern AsiaSouthern EuropeSpainSri LankaSt. Vincent and the GrenadinesSudanSwedenSwitzerlandSyriaTaiwanThailandTrinidad and TobagoTurkeyUgandaUkraineUruguayUzbekistanVenezuelaVietnamWest IndiesWestern AfricaWestern AsiaWestern EuropeYemenZaireZimbabweAzores
Median Family Income
Income
Poverty
Unemployment
Labor Participation
Family Structure
Vehicle Availability
Education Level
Disability

Median Family Income Comparison

Slavs

Immigrants from Eritrea

Good
Average
$105,144
MEDIAN FAMILY INCOME
77.9/ 100
METRIC RATING
153rd/ 347
METRIC RANK
$102,823
MEDIAN FAMILY INCOME
51.9/ 100
METRIC RATING
172nd/ 347
METRIC RANK

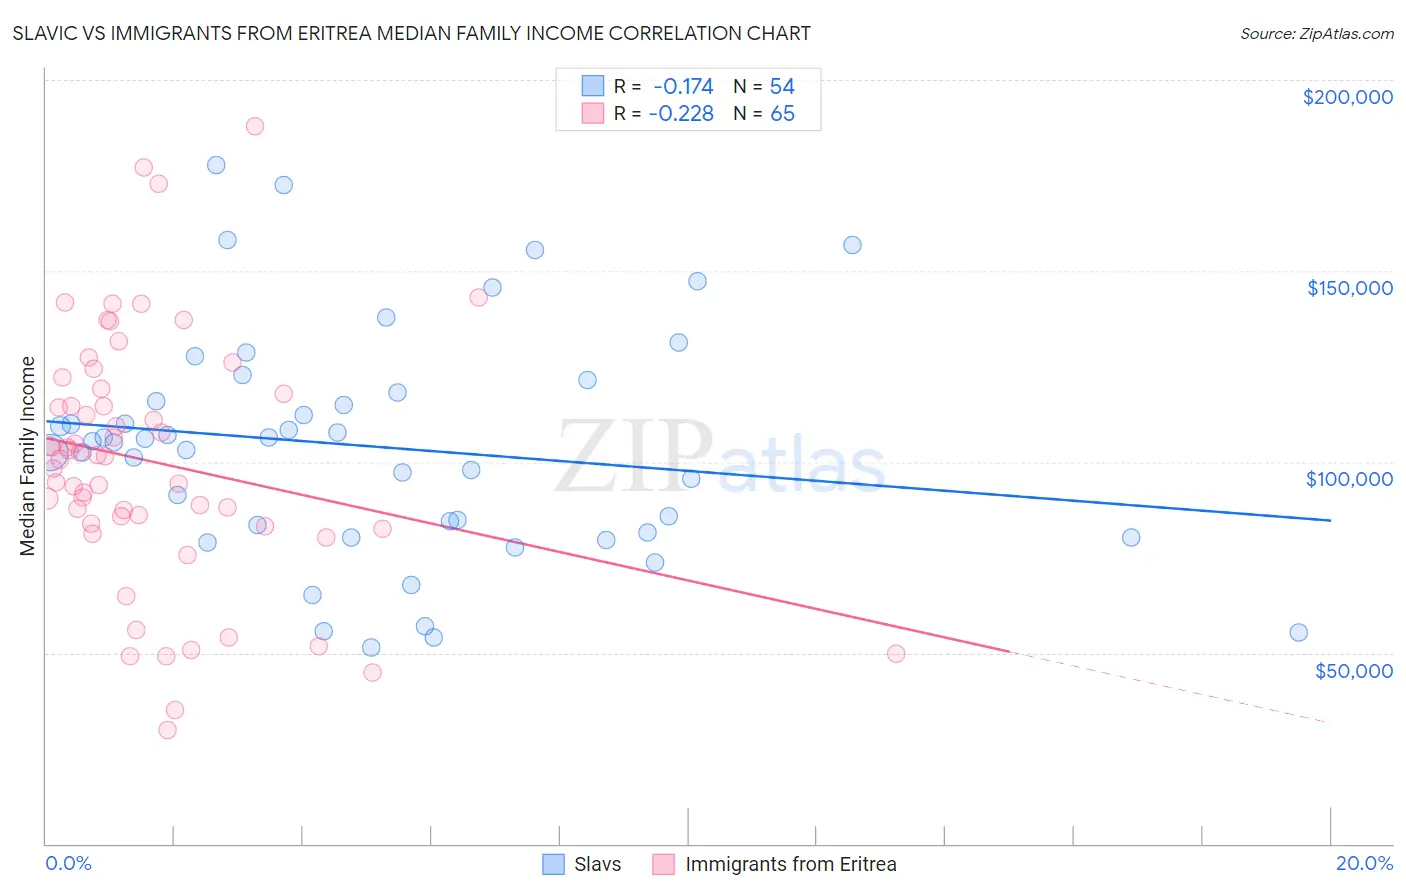
Slavic vs Immigrants from Eritrea Median Family Income Correlation Chart

The statistical analysis conducted on geographies consisting of 270,767,146 people shows a poor negative correlation between the proportion of Slavs and median family income in the United States with a correlation coefficient (R) of -0.174 and weighted average of $105,144. Similarly, the statistical analysis conducted on geographies consisting of 104,842,839 people shows a weak negative correlation between the proportion of Immigrants from Eritrea and median family income in the United States with a correlation coefficient (R) of -0.228 and weighted average of $102,823, a difference of 2.3%.
Slavic vs Immigrants from Eritrea Median Family Income

Median Family Income Correlation Summary

MeasurementSlavicImmigrants from Eritrea
Minimum$51,429$29,777
Maximum$177,700$188,047
Range$126,271$158,270
Mean$103,941$99,919
Median$105,172$101,536
Interquartile 25% (IQ1)$81,417$83,487
Interquartile 75% (IQ3)$118,102$118,485
Interquartile Range (IQR)$36,685$34,998
Standard Deviation (Sample)$30,026$32,848
Standard Deviation (Population)$29,746$32,595

Demographics Similar to Slavs and Immigrants from Eritrea by Median Family Income

In terms of median family income, the demographic groups most similar to Slavs are Immigrants from Albania ($105,285, a difference of 0.13%), Immigrants from Nepal ($104,966, a difference of 0.17%), Native Hawaiian ($104,910, a difference of 0.22%), Basque ($104,760, a difference of 0.37%), and Moroccan ($104,488, a difference of 0.63%). Similarly, the demographic groups most similar to Immigrants from Eritrea are Alsatian ($103,010, a difference of 0.18%), Immigrants from Uzbekistan ($103,197, a difference of 0.36%), Czechoslovakian ($103,273, a difference of 0.44%), Immigrants from Peru ($103,534, a difference of 0.69%), and South American Indian ($103,624, a difference of 0.78%).
DemographicsRating | RankMedian Family Income
Immigrants | Albania
79.1
/100
|
#152
Good
$105,285
Slavs
77.9
/100
|
#153
Good
$105,144
Immigrants | Nepal
76.3
/100
|
#154
Good
$104,966
Native Hawaiians
75.8
/100
|
#155
Good
$104,910
Basques
74.4
/100
|
#156
Good
$104,760
Moroccans
71.6
/100
|
#157
Good
$104,488
Scandinavians
70.8
/100
|
#158
Good
$104,410
Swiss
70.7
/100
|
#159
Good
$104,396
Scottish
69.5
/100
|
#160
Good
$104,288
Icelanders
69.4
/100
|
#161
Good
$104,282
Immigrants | Sierra Leone
66.2
/100
|
#162
Good
$103,990
Costa Ricans
66.2
/100
|
#163
Good
$103,989
Sierra Leoneans
64.7
/100
|
#164
Good
$103,859
Slovaks
63.1
/100
|
#165
Good
$103,729
English
62.6
/100
|
#166
Good
$103,684
South American Indians
61.9
/100
|
#167
Good
$103,624
Immigrants | Peru
60.8
/100
|
#168
Good
$103,534
Czechoslovakians
57.6
/100
|
#169
Average
$103,273
Immigrants | Uzbekistan
56.6
/100
|
#170
Average
$103,197
Alsatians
54.3
/100
|
#171
Average
$103,010
Immigrants | Eritrea
51.9
/100
|
#172
Average
$102,823