Iraqi vs Immigrants from Eritrea Associate's Degree
COMPARE
Iraqi
Immigrants from Eritrea
Associate's Degree
Associate's Degree Comparison
Iraqis
Immigrants from Eritrea
47.4%
ASSOCIATE'S DEGREE
76.2/ 100
METRIC RATING
150th/ 347
METRIC RANK
48.1%
ASSOCIATE'S DEGREE
87.8/ 100
METRIC RATING
137th/ 347
METRIC RANK
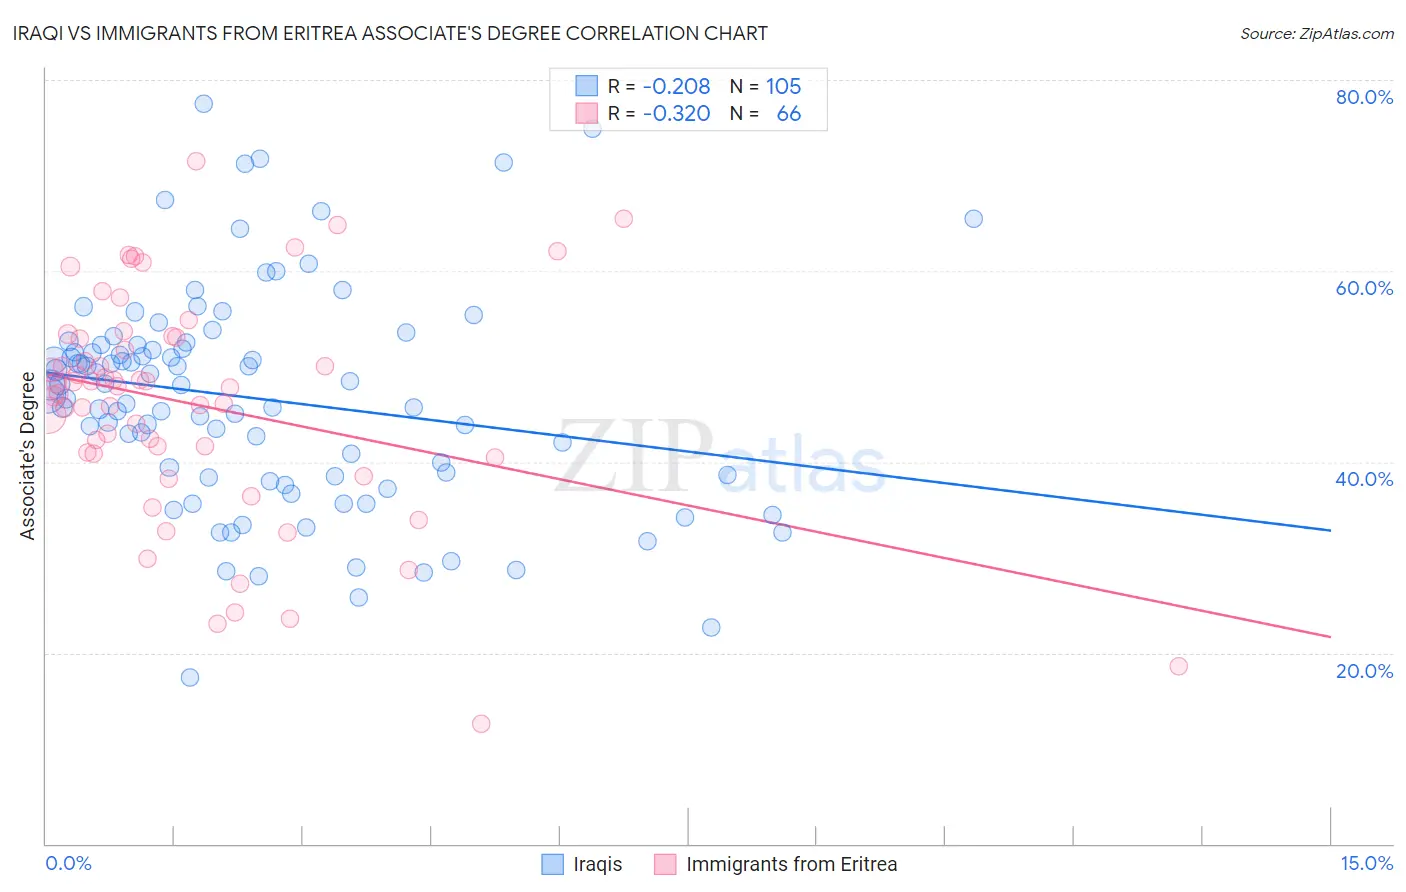
Iraqi vs Immigrants from Eritrea Associate's Degree Correlation Chart
The statistical analysis conducted on geographies consisting of 170,654,197 people shows a weak negative correlation between the proportion of Iraqis and percentage of population with at least associate's degree education in the United States with a correlation coefficient (R) of -0.208 and weighted average of 47.4%. Similarly, the statistical analysis conducted on geographies consisting of 104,852,788 people shows a mild negative correlation between the proportion of Immigrants from Eritrea and percentage of population with at least associate's degree education in the United States with a correlation coefficient (R) of -0.320 and weighted average of 48.1%, a difference of 1.5%.
Associate's Degree Correlation Summary
| Measurement | Iraqi | Immigrants from Eritrea |
| Minimum | 17.5% | 12.6% |
| Maximum | 77.6% | 71.5% |
| Range | 60.1% | 58.9% |
| Mean | 46.6% | 46.0% |
| Median | 48.1% | 47.9% |
| Interquartile 25% (IQ1) | 38.4% | 40.9% |
| Interquartile 75% (IQ3) | 52.3% | 53.1% |
| Interquartile Range (IQR) | 13.8% | 12.2% |
| Standard Deviation (Sample) | 11.5% | 11.9% |
| Standard Deviation (Population) | 11.4% | 11.8% |
Demographics Similar to Iraqis and Immigrants from Eritrea by Associate's Degree
In terms of associate's degree, the demographic groups most similar to Iraqis are Immigrants from North Macedonia (47.4%, a difference of 0.020%), Immigrants from Armenia (47.4%, a difference of 0.040%), South American Indian (47.4%, a difference of 0.050%), Danish (47.4%, a difference of 0.11%), and Immigrants from Sudan (47.4%, a difference of 0.17%). Similarly, the demographic groups most similar to Immigrants from Eritrea are Pakistani (48.1%, a difference of 0.040%), Polish (48.0%, a difference of 0.070%), European (48.2%, a difference of 0.22%), Moroccan (48.2%, a difference of 0.28%), and Assyrian/Chaldean/Syriac (48.2%, a difference of 0.30%).
| Demographics | Rating | Rank | Associate's Degree |
| Assyrians/Chaldeans/Syriacs | 89.4 /100 | #133 | Excellent 48.2% |
| Moroccans | 89.3 /100 | #134 | Excellent 48.2% |
| Europeans | 89.0 /100 | #135 | Excellent 48.2% |
| Pakistanis | 88.0 /100 | #136 | Excellent 48.1% |
| Immigrants | Eritrea | 87.8 /100 | #137 | Excellent 48.1% |
| Poles | 87.3 /100 | #138 | Excellent 48.0% |
| Slovenes | 85.1 /100 | #139 | Excellent 47.9% |
| Immigrants | Southern Europe | 84.4 /100 | #140 | Excellent 47.8% |
| Taiwanese | 83.3 /100 | #141 | Excellent 47.7% |
| Sierra Leoneans | 82.9 /100 | #142 | Excellent 47.7% |
| Norwegians | 81.0 /100 | #143 | Excellent 47.6% |
| Slavs | 80.5 /100 | #144 | Excellent 47.6% |
| Canadians | 79.0 /100 | #145 | Good 47.5% |
| Immigrants | Sudan | 77.9 /100 | #146 | Good 47.4% |
| Danes | 77.3 /100 | #147 | Good 47.4% |
| South American Indians | 76.7 /100 | #148 | Good 47.4% |
| Immigrants | Armenia | 76.6 /100 | #149 | Good 47.4% |
| Iraqis | 76.2 /100 | #150 | Good 47.4% |
| Immigrants | North Macedonia | 76.0 /100 | #151 | Good 47.4% |
| Immigrants | Afghanistan | 74.3 /100 | #152 | Good 47.3% |
| Czechs | 72.2 /100 | #153 | Good 47.2% |