Immigrants from Korea vs Ethiopian Births to Unmarried Women
COMPARE
Immigrants from Korea
Ethiopian
Births to Unmarried Women
Births to Unmarried Women Comparison
Immigrants from Korea
Ethiopians
26.3%
BIRTHS TO UNMARRIED WOMEN
99.9/ 100
METRIC RATING
20th/ 347
METRIC RANK
29.8%
BIRTHS TO UNMARRIED WOMEN
91.9/ 100
METRIC RATING
115th/ 347
METRIC RANK
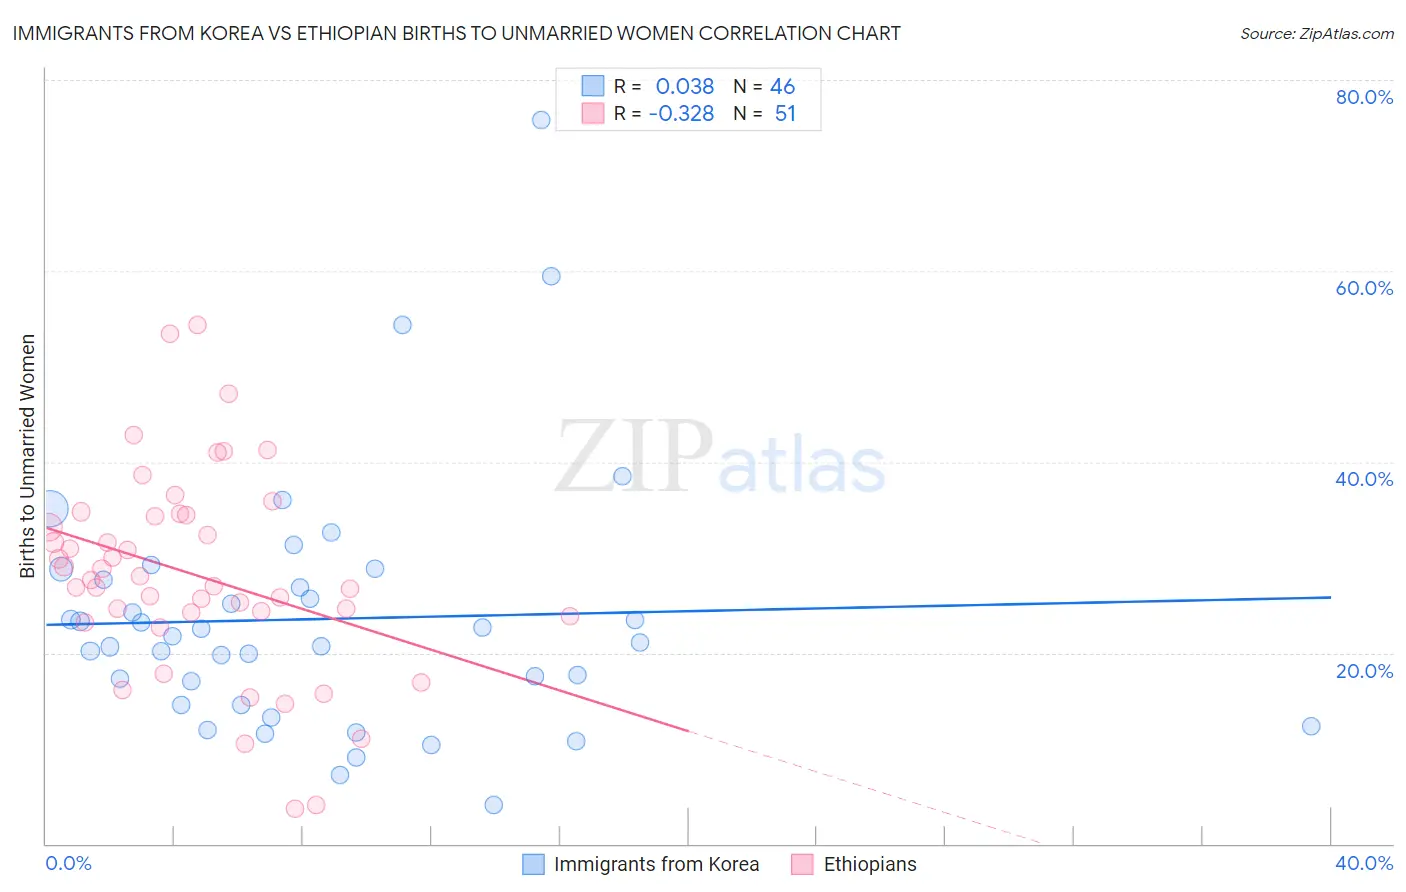
Immigrants from Korea vs Ethiopian Births to Unmarried Women Correlation Chart
The statistical analysis conducted on geographies consisting of 385,969,141 people shows no correlation between the proportion of Immigrants from Korea and percentage of births to unmarried women in the United States with a correlation coefficient (R) of 0.038 and weighted average of 26.3%. Similarly, the statistical analysis conducted on geographies consisting of 215,740,529 people shows a mild negative correlation between the proportion of Ethiopians and percentage of births to unmarried women in the United States with a correlation coefficient (R) of -0.328 and weighted average of 29.8%, a difference of 13.6%.
Births to Unmarried Women Correlation Summary
| Measurement | Immigrants from Korea | Ethiopian |
| Minimum | 4.1% | 3.7% |
| Maximum | 75.8% | 54.3% |
| Range | 71.7% | 50.6% |
| Mean | 23.5% | 28.2% |
| Median | 21.4% | 27.6% |
| Interquartile 25% (IQ1) | 14.6% | 23.8% |
| Interquartile 75% (IQ3) | 27.6% | 34.4% |
| Interquartile Range (IQR) | 13.0% | 10.6% |
| Standard Deviation (Sample) | 13.3% | 10.7% |
| Standard Deviation (Population) | 13.2% | 10.6% |
Similar Demographics by Births to Unmarried Women
Demographics Similar to Immigrants from Korea by Births to Unmarried Women
In terms of births to unmarried women, the demographic groups most similar to Immigrants from Korea are Soviet Union (26.3%, a difference of 0.13%), Armenian (26.2%, a difference of 0.21%), Burmese (26.4%, a difference of 0.36%), Immigrants from Japan (26.4%, a difference of 0.55%), and Immigrants from Armenia (26.1%, a difference of 0.80%).
| Demographics | Rating | Rank | Births to Unmarried Women |
| Iranians | 100.0 /100 | #13 | Exceptional 25.3% |
| Immigrants | Lebanon | 100.0 /100 | #14 | Exceptional 25.3% |
| Immigrants | Singapore | 100.0 /100 | #15 | Exceptional 25.6% |
| Immigrants | Belarus | 100.0 /100 | #16 | Exceptional 25.6% |
| Immigrants | Uzbekistan | 100.0 /100 | #17 | Exceptional 25.8% |
| Immigrants | Armenia | 99.9 /100 | #18 | Exceptional 26.1% |
| Armenians | 99.9 /100 | #19 | Exceptional 26.2% |
| Immigrants | Korea | 99.9 /100 | #20 | Exceptional 26.3% |
| Soviet Union | 99.9 /100 | #21 | Exceptional 26.3% |
| Burmese | 99.9 /100 | #22 | Exceptional 26.4% |
| Immigrants | Japan | 99.9 /100 | #23 | Exceptional 26.4% |
| Immigrants | Australia | 99.9 /100 | #24 | Exceptional 26.6% |
| Cambodians | 99.9 /100 | #25 | Exceptional 26.7% |
| Asians | 99.9 /100 | #26 | Exceptional 26.8% |
| Immigrants | Asia | 99.9 /100 | #27 | Exceptional 26.8% |
Demographics Similar to Ethiopians by Births to Unmarried Women
In terms of births to unmarried women, the demographic groups most similar to Ethiopians are Immigrants from Italy (29.9%, a difference of 0.080%), Immigrants from Croatia (29.8%, a difference of 0.22%), Scandinavian (29.8%, a difference of 0.28%), Immigrants from Netherlands (29.9%, a difference of 0.29%), and Immigrants from Norway (29.9%, a difference of 0.31%).
| Demographics | Rating | Rank | Births to Unmarried Women |
| Paraguayans | 93.5 /100 | #108 | Exceptional 29.7% |
| Greeks | 93.4 /100 | #109 | Exceptional 29.7% |
| Immigrants | Ethiopia | 93.4 /100 | #110 | Exceptional 29.7% |
| Immigrants | Hungary | 93.0 /100 | #111 | Exceptional 29.7% |
| Basques | 93.0 /100 | #112 | Exceptional 29.7% |
| Scandinavians | 92.7 /100 | #113 | Exceptional 29.8% |
| Immigrants | Croatia | 92.6 /100 | #114 | Exceptional 29.8% |
| Ethiopians | 91.9 /100 | #115 | Exceptional 29.8% |
| Immigrants | Italy | 91.7 /100 | #116 | Exceptional 29.9% |
| Immigrants | Netherlands | 91.1 /100 | #117 | Exceptional 29.9% |
| Immigrants | Norway | 91.0 /100 | #118 | Exceptional 29.9% |
| Argentineans | 90.5 /100 | #119 | Exceptional 30.0% |
| Ugandans | 89.2 /100 | #120 | Excellent 30.1% |
| Koreans | 88.9 /100 | #121 | Excellent 30.1% |
| Immigrants | Argentina | 88.7 /100 | #122 | Excellent 30.1% |