Immigrants from Hungary vs British Wage/Income Gap
COMPARE
Immigrants from Hungary
British
Wage/Income Gap
Wage/Income Gap Comparison
Immigrants from Hungary
British
27.0%
WAGE/INCOME GAP
4.8/ 100
METRIC RATING
235th/ 347
METRIC RANK
28.9%
WAGE/INCOME GAP
0.1/ 100
METRIC RATING
320th/ 347
METRIC RANK
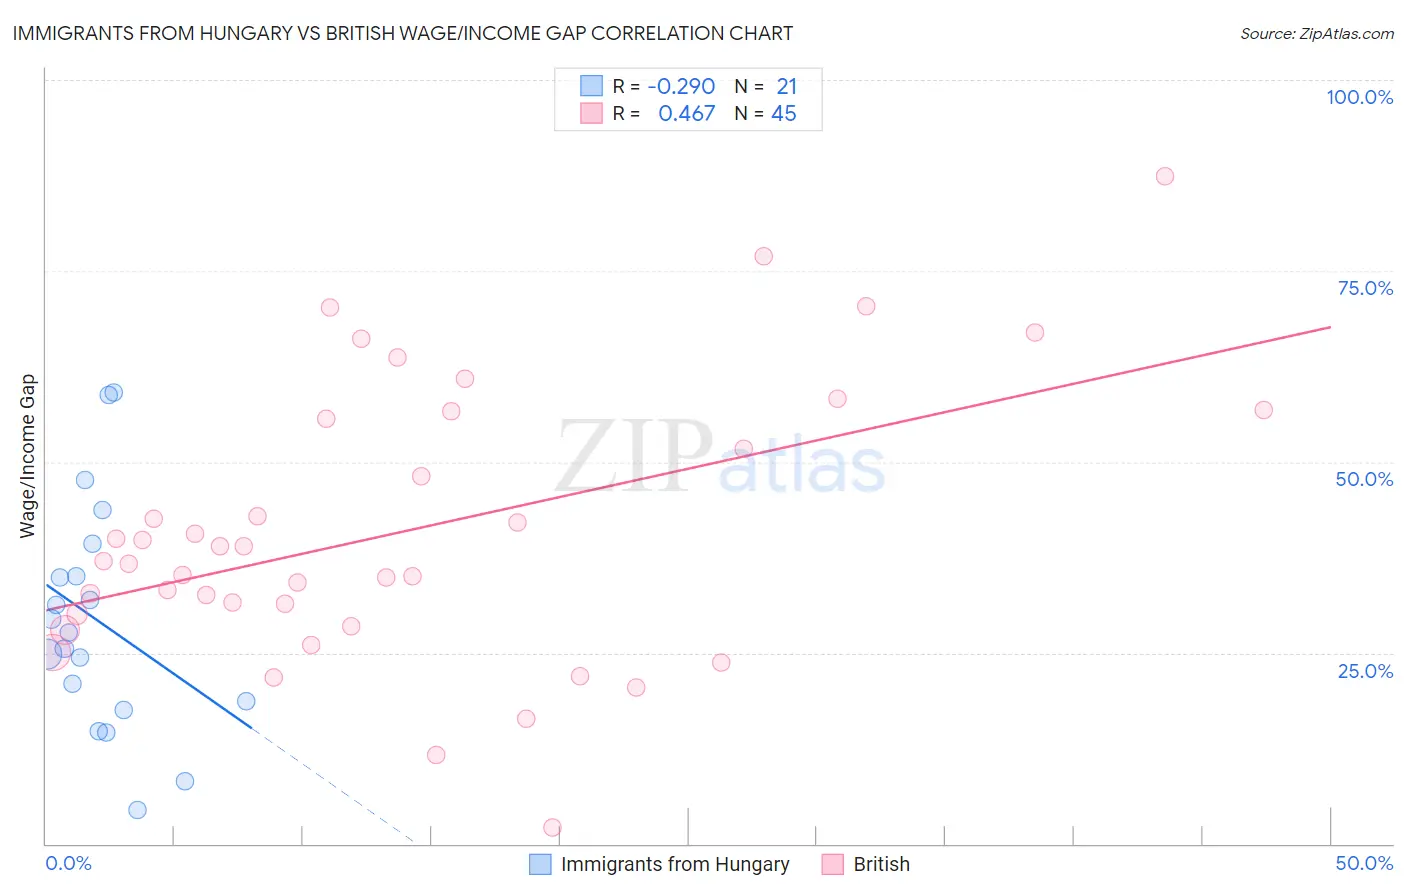
Immigrants from Hungary vs British Wage/Income Gap Correlation Chart
The statistical analysis conducted on geographies consisting of 195,626,970 people shows a weak negative correlation between the proportion of Immigrants from Hungary and wage/income gap percentage in the United States with a correlation coefficient (R) of -0.290 and weighted average of 27.0%. Similarly, the statistical analysis conducted on geographies consisting of 530,131,618 people shows a moderate positive correlation between the proportion of British and wage/income gap percentage in the United States with a correlation coefficient (R) of 0.467 and weighted average of 28.9%, a difference of 6.9%.
Wage/Income Gap Correlation Summary
| Measurement | Immigrants from Hungary | British |
| Minimum | 4.4% | 2.2% |
| Maximum | 59.1% | 87.4% |
| Range | 54.6% | 85.2% |
| Mean | 29.2% | 41.0% |
| Median | 27.6% | 37.0% |
| Interquartile 25% (IQ1) | 18.1% | 29.3% |
| Interquartile 75% (IQ3) | 37.2% | 56.1% |
| Interquartile Range (IQR) | 19.1% | 26.8% |
| Standard Deviation (Sample) | 14.7% | 18.1% |
| Standard Deviation (Population) | 14.4% | 17.9% |
Similar Demographics by Wage/Income Gap
Demographics Similar to Immigrants from Hungary by Wage/Income Gap
In terms of wage/income gap, the demographic groups most similar to Immigrants from Hungary are Immigrants from Pakistan (27.0%, a difference of 0.010%), Immigrants from Romania (27.0%, a difference of 0.020%), Immigrants from Brazil (27.0%, a difference of 0.060%), Argentinean (27.0%, a difference of 0.12%), and Bhutanese (27.0%, a difference of 0.15%).
| Demographics | Rating | Rank | Wage/Income Gap |
| Immigrants | Turkey | 5.6 /100 | #228 | Tragic 27.0% |
| Immigrants | Asia | 5.5 /100 | #229 | Tragic 27.0% |
| Ottawa | 5.3 /100 | #230 | Tragic 27.0% |
| Bhutanese | 5.3 /100 | #231 | Tragic 27.0% |
| Argentineans | 5.2 /100 | #232 | Tragic 27.0% |
| Immigrants | Brazil | 5.0 /100 | #233 | Tragic 27.0% |
| Immigrants | Pakistan | 4.9 /100 | #234 | Tragic 27.0% |
| Immigrants | Hungary | 4.8 /100 | #235 | Tragic 27.0% |
| Immigrants | Romania | 4.8 /100 | #236 | Tragic 27.0% |
| Immigrants | Eastern Asia | 4.4 /100 | #237 | Tragic 27.1% |
| Osage | 4.4 /100 | #238 | Tragic 27.1% |
| Estonians | 4.3 /100 | #239 | Tragic 27.1% |
| Immigrants | Europe | 3.8 /100 | #240 | Tragic 27.1% |
| Creek | 3.8 /100 | #241 | Tragic 27.1% |
| Immigrants | Sri Lanka | 3.7 /100 | #242 | Tragic 27.1% |
Demographics Similar to British by Wage/Income Gap
In terms of wage/income gap, the demographic groups most similar to British are Slovak (28.9%, a difference of 0.060%), Welsh (28.9%, a difference of 0.070%), Immigrants from Singapore (28.9%, a difference of 0.080%), Norwegian (29.0%, a difference of 0.19%), and Croatian (29.0%, a difference of 0.31%).
| Demographics | Rating | Rank | Wage/Income Gap |
| French | 0.1 /100 | #313 | Tragic 28.7% |
| Immigrants | Scotland | 0.1 /100 | #314 | Tragic 28.7% |
| Maltese | 0.1 /100 | #315 | Tragic 28.7% |
| Lithuanians | 0.1 /100 | #316 | Tragic 28.7% |
| Belgians | 0.1 /100 | #317 | Tragic 28.8% |
| Basques | 0.1 /100 | #318 | Tragic 28.8% |
| Slovaks | 0.1 /100 | #319 | Tragic 28.9% |
| British | 0.1 /100 | #320 | Tragic 28.9% |
| Welsh | 0.1 /100 | #321 | Tragic 28.9% |
| Immigrants | Singapore | 0.1 /100 | #322 | Tragic 28.9% |
| Norwegians | 0.1 /100 | #323 | Tragic 29.0% |
| Croatians | 0.0 /100 | #324 | Tragic 29.0% |
| Hungarians | 0.0 /100 | #325 | Tragic 29.0% |
| Immigrants | Belgium | 0.0 /100 | #326 | Tragic 29.0% |
| Immigrants | Iran | 0.0 /100 | #327 | Tragic 29.1% |