Immigrants from Hungary vs Immigrants from Liberia Wage/Income Gap
COMPARE
Immigrants from Hungary
Immigrants from Liberia
Wage/Income Gap
Wage/Income Gap Comparison
Immigrants from Hungary
Immigrants from Liberia
27.0%
WAGE/INCOME GAP
4.8/ 100
METRIC RATING
235th/ 347
METRIC RANK
20.6%
WAGE/INCOME GAP
100.0/ 100
METRIC RATING
22nd/ 347
METRIC RANK
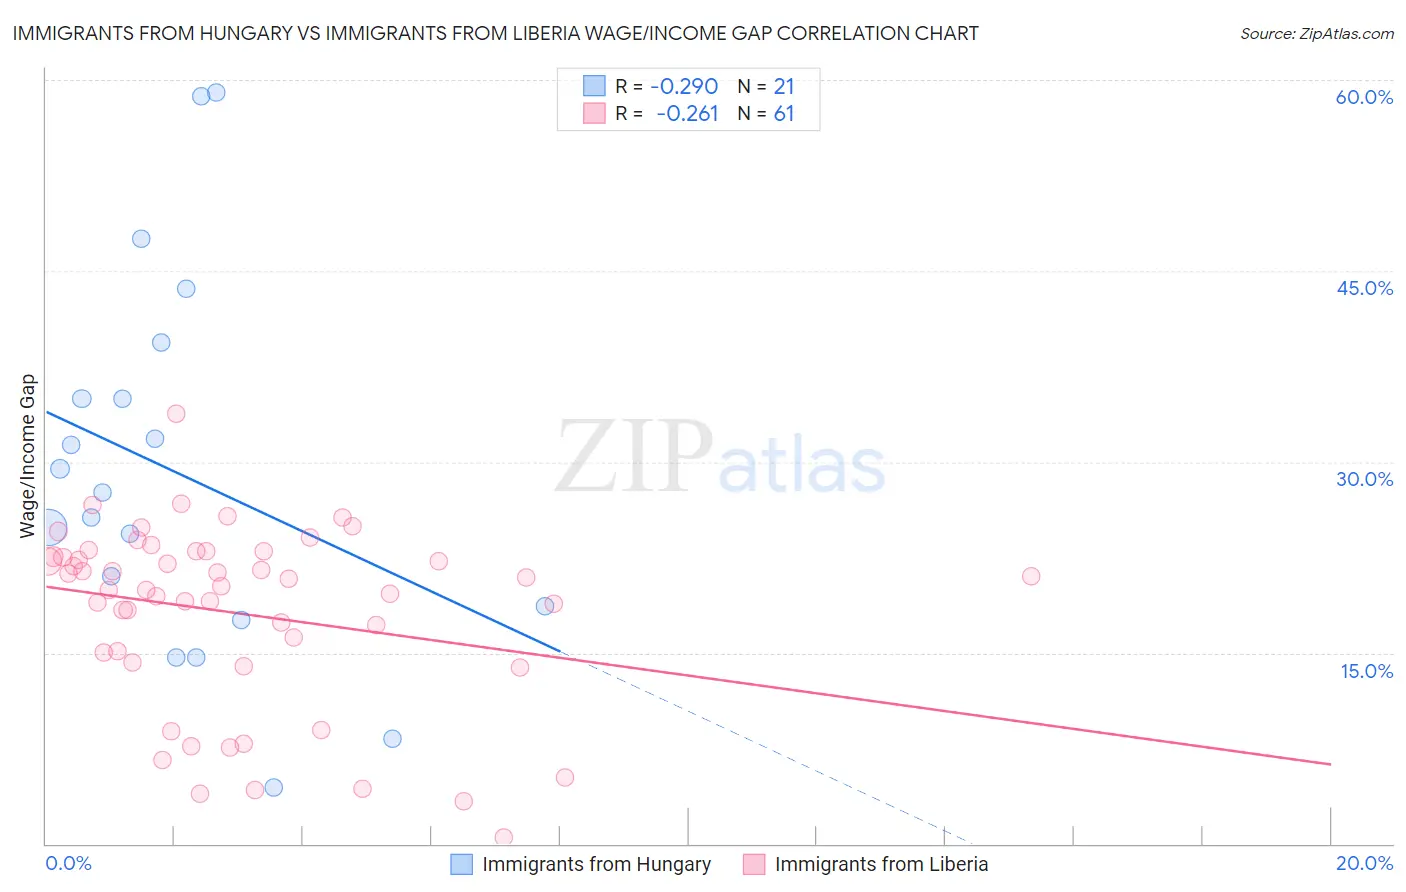
Immigrants from Hungary vs Immigrants from Liberia Wage/Income Gap Correlation Chart
The statistical analysis conducted on geographies consisting of 195,626,970 people shows a weak negative correlation between the proportion of Immigrants from Hungary and wage/income gap percentage in the United States with a correlation coefficient (R) of -0.290 and weighted average of 27.0%. Similarly, the statistical analysis conducted on geographies consisting of 135,262,187 people shows a weak negative correlation between the proportion of Immigrants from Liberia and wage/income gap percentage in the United States with a correlation coefficient (R) of -0.261 and weighted average of 20.6%, a difference of 31.5%.
Wage/Income Gap Correlation Summary
| Measurement | Immigrants from Hungary | Immigrants from Liberia |
| Minimum | 4.4% | 0.44% |
| Maximum | 59.1% | 33.8% |
| Range | 54.6% | 33.3% |
| Mean | 29.2% | 18.1% |
| Median | 27.6% | 20.2% |
| Interquartile 25% (IQ1) | 18.1% | 14.7% |
| Interquartile 75% (IQ3) | 37.2% | 22.8% |
| Interquartile Range (IQR) | 19.1% | 8.1% |
| Standard Deviation (Sample) | 14.7% | 7.1% |
| Standard Deviation (Population) | 14.4% | 7.1% |
Similar Demographics by Wage/Income Gap
Demographics Similar to Immigrants from Hungary by Wage/Income Gap
In terms of wage/income gap, the demographic groups most similar to Immigrants from Hungary are Immigrants from Pakistan (27.0%, a difference of 0.010%), Immigrants from Romania (27.0%, a difference of 0.020%), Immigrants from Brazil (27.0%, a difference of 0.060%), Argentinean (27.0%, a difference of 0.12%), and Bhutanese (27.0%, a difference of 0.15%).
| Demographics | Rating | Rank | Wage/Income Gap |
| Immigrants | Turkey | 5.6 /100 | #228 | Tragic 27.0% |
| Immigrants | Asia | 5.5 /100 | #229 | Tragic 27.0% |
| Ottawa | 5.3 /100 | #230 | Tragic 27.0% |
| Bhutanese | 5.3 /100 | #231 | Tragic 27.0% |
| Argentineans | 5.2 /100 | #232 | Tragic 27.0% |
| Immigrants | Brazil | 5.0 /100 | #233 | Tragic 27.0% |
| Immigrants | Pakistan | 4.9 /100 | #234 | Tragic 27.0% |
| Immigrants | Hungary | 4.8 /100 | #235 | Tragic 27.0% |
| Immigrants | Romania | 4.8 /100 | #236 | Tragic 27.0% |
| Immigrants | Eastern Asia | 4.4 /100 | #237 | Tragic 27.1% |
| Osage | 4.4 /100 | #238 | Tragic 27.1% |
| Estonians | 4.3 /100 | #239 | Tragic 27.1% |
| Immigrants | Europe | 3.8 /100 | #240 | Tragic 27.1% |
| Creek | 3.8 /100 | #241 | Tragic 27.1% |
| Immigrants | Sri Lanka | 3.7 /100 | #242 | Tragic 27.1% |
Demographics Similar to Immigrants from Liberia by Wage/Income Gap
In terms of wage/income gap, the demographic groups most similar to Immigrants from Liberia are Immigrants from Dominican Republic (20.6%, a difference of 0.020%), Dominican (20.6%, a difference of 0.19%), Senegalese (20.7%, a difference of 0.49%), Pueblo (20.7%, a difference of 0.61%), and Immigrants from Caribbean (20.4%, a difference of 0.79%).
| Demographics | Rating | Rank | Wage/Income Gap |
| West Indians | 100.0 /100 | #15 | Exceptional 19.6% |
| Jamaicans | 100.0 /100 | #16 | Exceptional 19.6% |
| Haitians | 100.0 /100 | #17 | Exceptional 19.7% |
| Hopi | 100.0 /100 | #18 | Exceptional 20.0% |
| Immigrants | Dominica | 100.0 /100 | #19 | Exceptional 20.0% |
| Bahamians | 100.0 /100 | #20 | Exceptional 20.2% |
| Immigrants | Caribbean | 100.0 /100 | #21 | Exceptional 20.4% |
| Immigrants | Liberia | 100.0 /100 | #22 | Exceptional 20.6% |
| Immigrants | Dominican Republic | 100.0 /100 | #23 | Exceptional 20.6% |
| Dominicans | 100.0 /100 | #24 | Exceptional 20.6% |
| Senegalese | 100.0 /100 | #25 | Exceptional 20.7% |
| Pueblo | 100.0 /100 | #26 | Exceptional 20.7% |
| Immigrants | Armenia | 100.0 /100 | #27 | Exceptional 20.7% |
| Inupiat | 100.0 /100 | #28 | Exceptional 20.8% |
| Immigrants | Senegal | 100.0 /100 | #29 | Exceptional 20.9% |