Immigrants from Hungary vs Immigrants from Cambodia In Labor Force | Age 20-24
COMPARE
Immigrants from Hungary
Immigrants from Cambodia
In Labor Force | Age 20-24
In Labor Force | Age 20-24 Comparison
Immigrants from Hungary
Immigrants from Cambodia
74.9%
IN LABOR FORCE | AGE 20-24
35.0/ 100
METRIC RATING
184th/ 347
METRIC RANK
75.4%
IN LABOR FORCE | AGE 20-24
76.7/ 100
METRIC RATING
148th/ 347
METRIC RANK
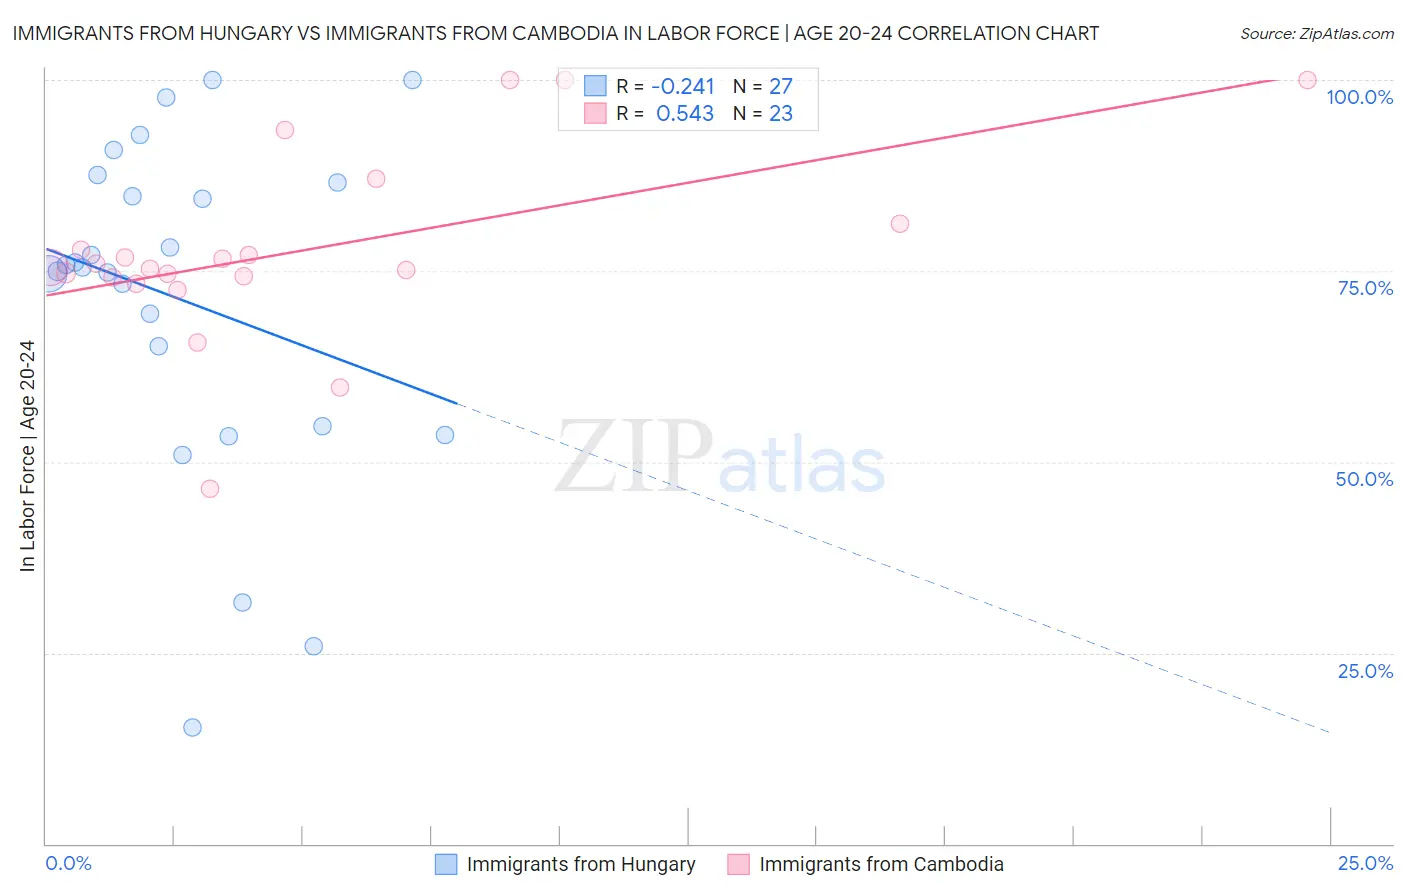
Immigrants from Hungary vs Immigrants from Cambodia In Labor Force | Age 20-24 Correlation Chart
The statistical analysis conducted on geographies consisting of 195,632,924 people shows a weak negative correlation between the proportion of Immigrants from Hungary and labor force participation rate among population between the ages 20 and 24 in the United States with a correlation coefficient (R) of -0.241 and weighted average of 74.9%. Similarly, the statistical analysis conducted on geographies consisting of 205,146,511 people shows a substantial positive correlation between the proportion of Immigrants from Cambodia and labor force participation rate among population between the ages 20 and 24 in the United States with a correlation coefficient (R) of 0.543 and weighted average of 75.4%, a difference of 0.67%.
In Labor Force | Age 20-24 Correlation Summary
| Measurement | Immigrants from Hungary | Immigrants from Cambodia |
| Minimum | 15.2% | 46.5% |
| Maximum | 100.0% | 100.0% |
| Range | 84.8% | 53.5% |
| Mean | 71.3% | 77.7% |
| Median | 75.5% | 75.4% |
| Interquartile 25% (IQ1) | 54.6% | 74.1% |
| Interquartile 75% (IQ3) | 86.5% | 81.2% |
| Interquartile Range (IQR) | 31.9% | 7.1% |
| Standard Deviation (Sample) | 21.8% | 12.4% |
| Standard Deviation (Population) | 21.4% | 12.1% |
Similar Demographics by In Labor Force | Age 20-24
Demographics Similar to Immigrants from Hungary by In Labor Force | Age 20-24
In terms of in labor force | age 20-24, the demographic groups most similar to Immigrants from Hungary are Sri Lankan (74.9%, a difference of 0.0%), Immigrants from Eastern Europe (74.9%, a difference of 0.020%), Immigrants from Honduras (74.9%, a difference of 0.020%), Immigrants from South Africa (74.9%, a difference of 0.030%), and Immigrants from Costa Rica (74.9%, a difference of 0.030%).
| Demographics | Rating | Rank | In Labor Force | Age 20-24 |
| Immigrants | Mexico | 47.8 /100 | #177 | Average 75.0% |
| Immigrants | Central America | 45.0 /100 | #178 | Average 75.0% |
| Immigrants | Latvia | 44.1 /100 | #179 | Average 75.0% |
| Immigrants | Czechoslovakia | 44.0 /100 | #180 | Average 75.0% |
| Africans | 42.5 /100 | #181 | Average 75.0% |
| Immigrants | South Africa | 36.9 /100 | #182 | Fair 74.9% |
| Immigrants | Costa Rica | 36.7 /100 | #183 | Fair 74.9% |
| Immigrants | Hungary | 35.0 /100 | #184 | Fair 74.9% |
| Sri Lankans | 34.9 /100 | #185 | Fair 74.9% |
| Immigrants | Eastern Europe | 33.8 /100 | #186 | Fair 74.9% |
| Immigrants | Honduras | 33.5 /100 | #187 | Fair 74.9% |
| Hondurans | 32.7 /100 | #188 | Fair 74.8% |
| Immigrants | Northern Europe | 32.6 /100 | #189 | Fair 74.8% |
| Russians | 32.2 /100 | #190 | Fair 74.8% |
| Senegalese | 28.1 /100 | #191 | Fair 74.8% |
Demographics Similar to Immigrants from Cambodia by In Labor Force | Age 20-24
In terms of in labor force | age 20-24, the demographic groups most similar to Immigrants from Cambodia are Ugandan (75.4%, a difference of 0.010%), Comanche (75.4%, a difference of 0.020%), Mexican American Indian (75.4%, a difference of 0.040%), Salvadoran (75.3%, a difference of 0.040%), and Paiute (75.3%, a difference of 0.050%).
| Demographics | Rating | Rank | In Labor Force | Age 20-24 |
| Romanians | 84.1 /100 | #141 | Excellent 75.5% |
| Blackfeet | 83.6 /100 | #142 | Excellent 75.5% |
| Spaniards | 82.0 /100 | #143 | Excellent 75.5% |
| Bhutanese | 80.8 /100 | #144 | Excellent 75.4% |
| Koreans | 79.7 /100 | #145 | Good 75.4% |
| Mexican American Indians | 78.8 /100 | #146 | Good 75.4% |
| Comanche | 77.6 /100 | #147 | Good 75.4% |
| Immigrants | Cambodia | 76.7 /100 | #148 | Good 75.4% |
| Ugandans | 76.1 /100 | #149 | Good 75.4% |
| Salvadorans | 74.8 /100 | #150 | Good 75.3% |
| Paiute | 74.1 /100 | #151 | Good 75.3% |
| Lebanese | 73.5 /100 | #152 | Good 75.3% |
| Guatemalans | 72.3 /100 | #153 | Good 75.3% |
| Osage | 72.3 /100 | #154 | Good 75.3% |
| Immigrants | Guatemala | 71.9 /100 | #155 | Good 75.3% |