Hungarian vs Immigrants from Philippines Per Capita Income
COMPARE
Hungarian
Immigrants from Philippines
Per Capita Income
Per Capita Income Comparison
Hungarians
Immigrants from Philippines
$45,426
PER CAPITA INCOME
87.9/ 100
METRIC RATING
135th/ 347
METRIC RANK
$44,000
PER CAPITA INCOME
59.4/ 100
METRIC RATING
165th/ 347
METRIC RANK
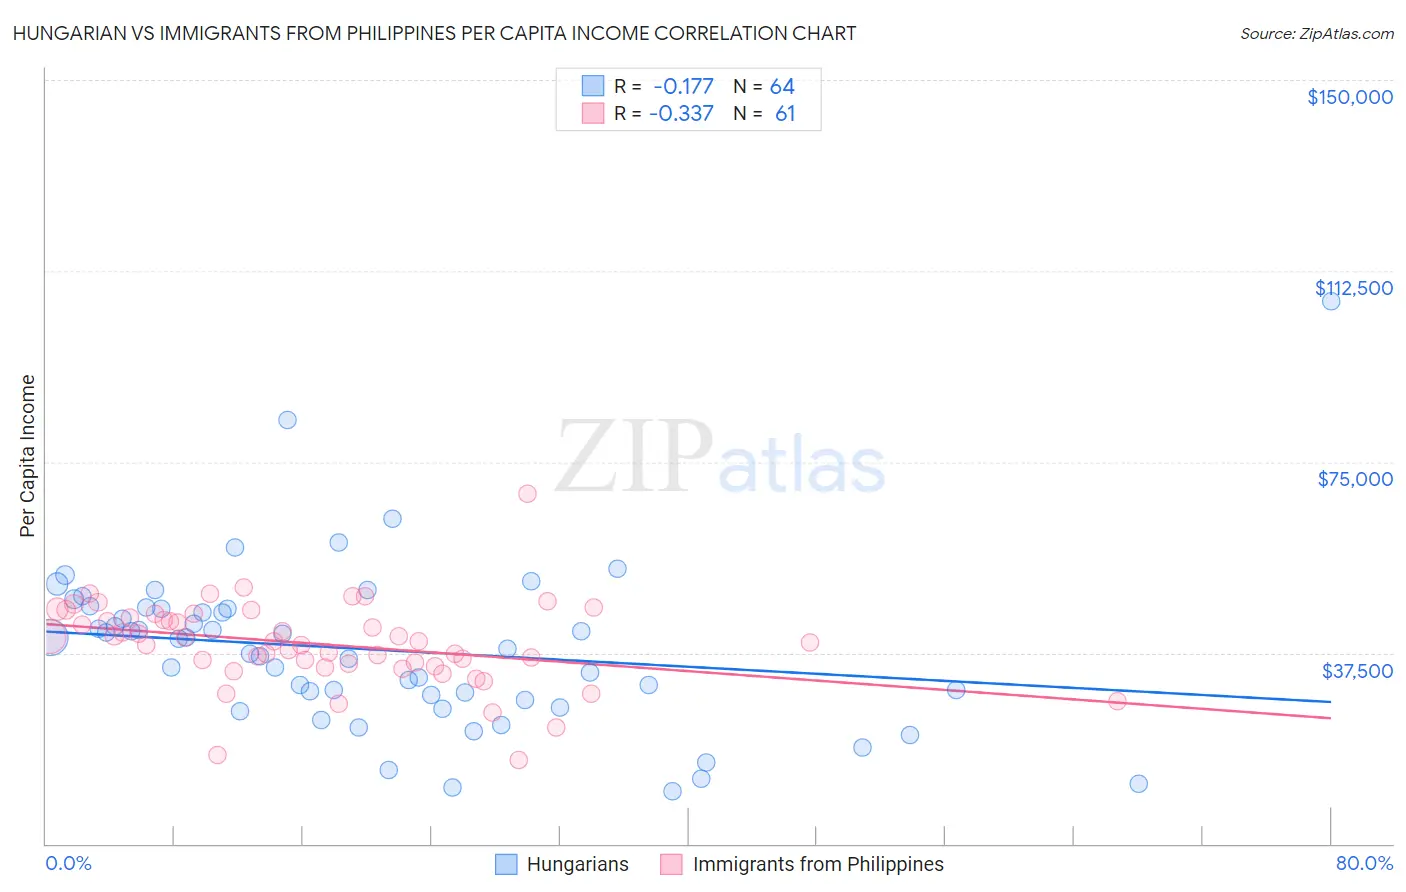
Hungarian vs Immigrants from Philippines Per Capita Income Correlation Chart
The statistical analysis conducted on geographies consisting of 486,270,132 people shows a poor negative correlation between the proportion of Hungarians and per capita income in the United States with a correlation coefficient (R) of -0.177 and weighted average of $45,426. Similarly, the statistical analysis conducted on geographies consisting of 471,310,372 people shows a mild negative correlation between the proportion of Immigrants from Philippines and per capita income in the United States with a correlation coefficient (R) of -0.337 and weighted average of $44,000, a difference of 3.2%.
Per Capita Income Correlation Summary
| Measurement | Hungarian | Immigrants from Philippines |
| Minimum | $10,415 | $16,552 |
| Maximum | $106,430 | $68,791 |
| Range | $96,015 | $52,239 |
| Mean | $38,150 | $39,238 |
| Median | $39,313 | $39,667 |
| Interquartile 25% (IQ1) | $28,777 | $35,101 |
| Interquartile 75% (IQ3) | $46,125 | $44,731 |
| Interquartile Range (IQR) | $17,348 | $9,631 |
| Standard Deviation (Sample) | $16,236 | $8,363 |
| Standard Deviation (Population) | $16,109 | $8,294 |
Similar Demographics by Per Capita Income
Demographics Similar to Hungarians by Per Capita Income
In terms of per capita income, the demographic groups most similar to Hungarians are Slovene ($45,581, a difference of 0.34%), Pakistani ($45,587, a difference of 0.35%), Jordanian ($45,605, a difference of 0.39%), Immigrants from North Macedonia ($45,622, a difference of 0.43%), and Immigrants from Oceania ($45,220, a difference of 0.46%).
| Demographics | Rating | Rank | Per Capita Income |
| Swedes | 91.3 /100 | #128 | Exceptional $45,750 |
| Luxembourgers | 90.4 /100 | #129 | Exceptional $45,663 |
| Arabs | 90.4 /100 | #130 | Exceptional $45,662 |
| Immigrants | North Macedonia | 90.0 /100 | #131 | Exceptional $45,622 |
| Jordanians | 89.9 /100 | #132 | Excellent $45,605 |
| Pakistanis | 89.7 /100 | #133 | Excellent $45,587 |
| Slovenes | 89.6 /100 | #134 | Excellent $45,581 |
| Hungarians | 87.9 /100 | #135 | Excellent $45,426 |
| Immigrants | Oceania | 85.2 /100 | #136 | Excellent $45,220 |
| Immigrants | Syria | 85.2 /100 | #137 | Excellent $45,218 |
| Assyrians/Chaldeans/Syriacs | 84.8 /100 | #138 | Excellent $45,195 |
| Basques | 83.2 /100 | #139 | Excellent $45,086 |
| Immigrants | Jordan | 82.9 /100 | #140 | Excellent $45,066 |
| Slavs | 82.6 /100 | #141 | Excellent $45,049 |
| Ugandans | 82.6 /100 | #142 | Excellent $45,047 |
Demographics Similar to Immigrants from Philippines by Per Capita Income
In terms of per capita income, the demographic groups most similar to Immigrants from Philippines are Immigrants from Uruguay ($43,997, a difference of 0.010%), Sri Lankan ($44,014, a difference of 0.030%), English ($43,982, a difference of 0.040%), Belgian ($43,951, a difference of 0.11%), and Immigrants from South America ($44,068, a difference of 0.15%).
| Demographics | Rating | Rank | Per Capita Income |
| Immigrants | Nepal | 64.3 /100 | #158 | Good $44,187 |
| South Americans | 62.4 /100 | #159 | Good $44,114 |
| Danes | 61.9 /100 | #160 | Good $44,095 |
| Costa Ricans | 61.8 /100 | #161 | Good $44,090 |
| Swiss | 61.4 /100 | #162 | Good $44,076 |
| Immigrants | South America | 61.2 /100 | #163 | Good $44,068 |
| Sri Lankans | 59.8 /100 | #164 | Average $44,014 |
| Immigrants | Philippines | 59.4 /100 | #165 | Average $44,000 |
| Immigrants | Uruguay | 59.3 /100 | #166 | Average $43,997 |
| English | 58.9 /100 | #167 | Average $43,982 |
| Belgians | 58.1 /100 | #168 | Average $43,951 |
| Immigrants | Peru | 55.3 /100 | #169 | Average $43,852 |
| Scandinavians | 55.2 /100 | #170 | Average $43,848 |
| Immigrants | Eastern Africa | 54.9 /100 | #171 | Average $43,838 |
| Czechoslovakians | 54.1 /100 | #172 | Average $43,806 |