Hungarian vs Maltese Per Capita Income
COMPARE
Hungarian
Maltese
Per Capita Income
Per Capita Income Comparison
Hungarians
Maltese
$45,426
PER CAPITA INCOME
87.9/ 100
METRIC RATING
135th/ 347
METRIC RANK
$49,640
PER CAPITA INCOME
99.9/ 100
METRIC RATING
63rd/ 347
METRIC RANK
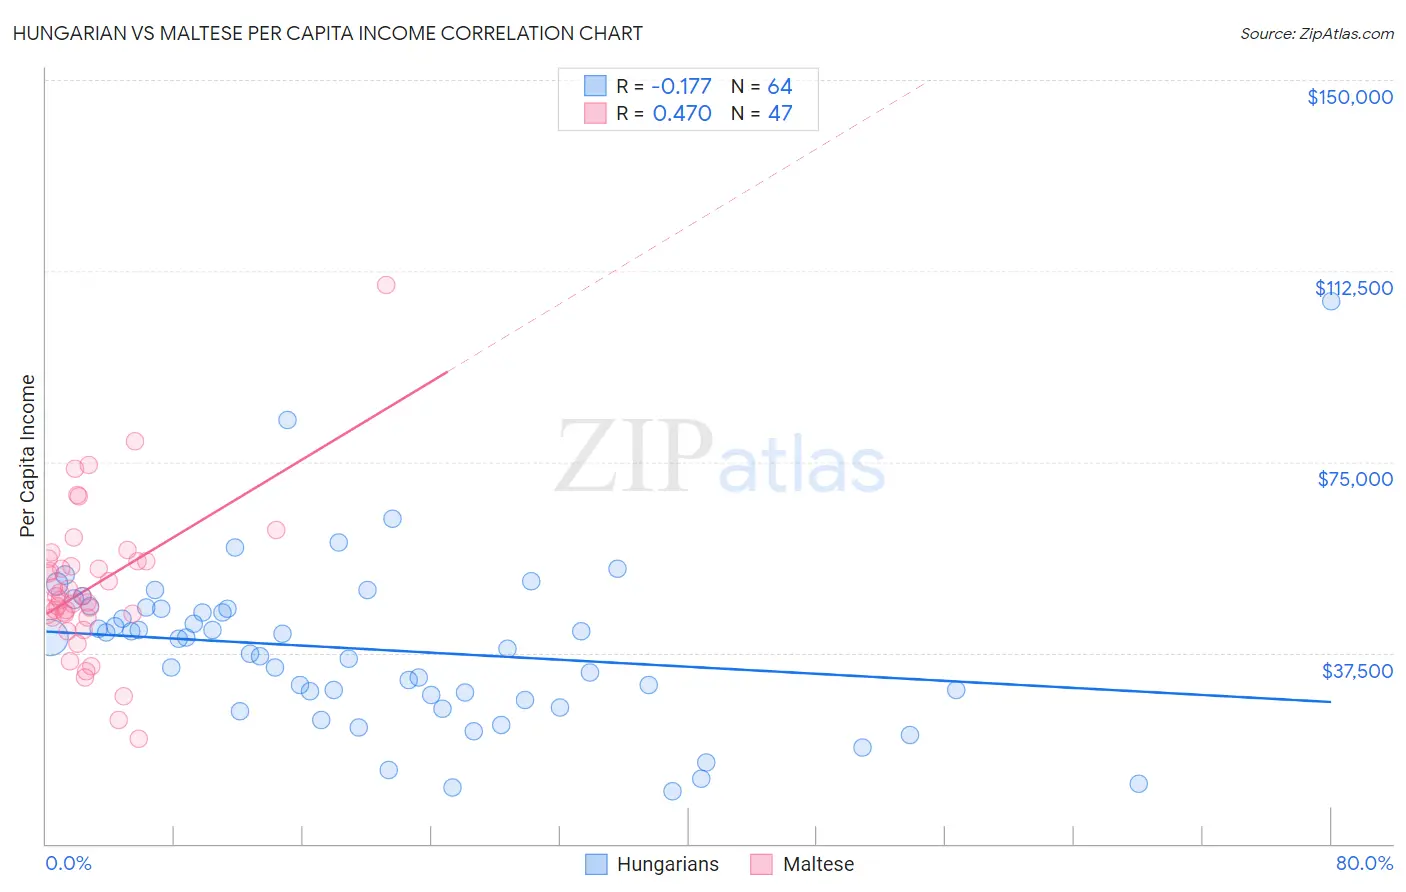
Hungarian vs Maltese Per Capita Income Correlation Chart
The statistical analysis conducted on geographies consisting of 486,270,132 people shows a poor negative correlation between the proportion of Hungarians and per capita income in the United States with a correlation coefficient (R) of -0.177 and weighted average of $45,426. Similarly, the statistical analysis conducted on geographies consisting of 126,316,532 people shows a moderate positive correlation between the proportion of Maltese and per capita income in the United States with a correlation coefficient (R) of 0.470 and weighted average of $49,640, a difference of 9.3%.
Per Capita Income Correlation Summary
| Measurement | Hungarian | Maltese |
| Minimum | $10,415 | $20,612 |
| Maximum | $106,430 | $109,686 |
| Range | $96,015 | $89,074 |
| Mean | $38,150 | $50,567 |
| Median | $39,313 | $48,495 |
| Interquartile 25% (IQ1) | $28,777 | $44,523 |
| Interquartile 75% (IQ3) | $46,125 | $55,569 |
| Interquartile Range (IQR) | $17,348 | $11,046 |
| Standard Deviation (Sample) | $16,236 | $14,877 |
| Standard Deviation (Population) | $16,109 | $14,718 |
Similar Demographics by Per Capita Income
Demographics Similar to Hungarians by Per Capita Income
In terms of per capita income, the demographic groups most similar to Hungarians are Slovene ($45,581, a difference of 0.34%), Pakistani ($45,587, a difference of 0.35%), Jordanian ($45,605, a difference of 0.39%), Immigrants from North Macedonia ($45,622, a difference of 0.43%), and Immigrants from Oceania ($45,220, a difference of 0.46%).
| Demographics | Rating | Rank | Per Capita Income |
| Swedes | 91.3 /100 | #128 | Exceptional $45,750 |
| Luxembourgers | 90.4 /100 | #129 | Exceptional $45,663 |
| Arabs | 90.4 /100 | #130 | Exceptional $45,662 |
| Immigrants | North Macedonia | 90.0 /100 | #131 | Exceptional $45,622 |
| Jordanians | 89.9 /100 | #132 | Excellent $45,605 |
| Pakistanis | 89.7 /100 | #133 | Excellent $45,587 |
| Slovenes | 89.6 /100 | #134 | Excellent $45,581 |
| Hungarians | 87.9 /100 | #135 | Excellent $45,426 |
| Immigrants | Oceania | 85.2 /100 | #136 | Excellent $45,220 |
| Immigrants | Syria | 85.2 /100 | #137 | Excellent $45,218 |
| Assyrians/Chaldeans/Syriacs | 84.8 /100 | #138 | Excellent $45,195 |
| Basques | 83.2 /100 | #139 | Excellent $45,086 |
| Immigrants | Jordan | 82.9 /100 | #140 | Excellent $45,066 |
| Slavs | 82.6 /100 | #141 | Excellent $45,049 |
| Ugandans | 82.6 /100 | #142 | Excellent $45,047 |
Demographics Similar to Maltese by Per Capita Income
In terms of per capita income, the demographic groups most similar to Maltese are Immigrants from Argentina ($49,627, a difference of 0.030%), Immigrants from Asia ($49,741, a difference of 0.20%), Bolivian ($49,526, a difference of 0.23%), Immigrants from Bulgaria ($49,482, a difference of 0.32%), and Immigrants from Romania ($49,463, a difference of 0.36%).
| Demographics | Rating | Rank | Per Capita Income |
| Asians | 99.9 /100 | #56 | Exceptional $50,057 |
| South Africans | 99.9 /100 | #57 | Exceptional $50,044 |
| Immigrants | Malaysia | 99.9 /100 | #58 | Exceptional $49,983 |
| Bhutanese | 99.9 /100 | #59 | Exceptional $49,894 |
| Immigrants | Scotland | 99.9 /100 | #60 | Exceptional $49,893 |
| Argentineans | 99.9 /100 | #61 | Exceptional $49,862 |
| Immigrants | Asia | 99.9 /100 | #62 | Exceptional $49,741 |
| Maltese | 99.9 /100 | #63 | Exceptional $49,640 |
| Immigrants | Argentina | 99.9 /100 | #64 | Exceptional $49,627 |
| Bolivians | 99.9 /100 | #65 | Exceptional $49,526 |
| Immigrants | Bulgaria | 99.9 /100 | #66 | Exceptional $49,482 |
| Immigrants | Romania | 99.9 /100 | #67 | Exceptional $49,463 |
| Lithuanians | 99.8 /100 | #68 | Exceptional $49,448 |
| Immigrants | Canada | 99.8 /100 | #69 | Exceptional $49,412 |
| Immigrants | Eastern Europe | 99.8 /100 | #70 | Exceptional $49,316 |