Hungarian vs Immigrants from Somalia Per Capita Income

COMPARE

Hungarian
Race
Ancestry
AfghanAfricanAlaska NativeAlaskan AthabascanAlbanianAleutAlsatianAmericanApacheArabArapahoArgentineanArmenianAssyrian/Chaldean/SyriacAustralianAustrianBahamianBangladeshiBarbadianBasqueBelgianBelizeanBermudanBhutaneseBlackfeetBolivianBrazilianBritishBritish West IndianBulgarianBurmeseCajunCambodianCanadianCape VerdeanCarpatho RusynCelticCentral AmericanCentral American IndianCherokeeCheyenneChickasawChileanChineseChippewaChoctawColombianColvilleComancheCosta RicanCreeCreekCroatianCrowCubanCypriotCzechCzechoslovakianDanishDelawareDominicanDutchDutch West IndianEastern EuropeanEcuadorianEgyptianEnglishEstonianEthiopianEuropeanFijianFilipinoFinnishFrenchFrench American IndianFrench CanadianGermanGerman RussianGhanaianGreekGuamanian/ChamorroGuatemalanGuyaneseHaitianHmongHonduranHopiHoumaHungarianIcelanderIndian (Asian)IndonesianInupiatIranianIraqiIrishIroquoisIsraeliItalianJamaicanJapaneseJordanianKenyanKiowaKoreanLaotianLatvianLebaneseLiberianLithuanianLumbeeLuxembourgerMacedonianMalaysianMalteseMarshalleseMenomineeMexicanMexican American IndianMongolianMoroccanNative HawaiianNavajoNepaleseNew ZealanderNicaraguanNigerianNorthern EuropeanNorwegianOkinawanOsageOttawaPaiutePakistaniPalestinianPanamanianParaguayanPennsylvania GermanPeruvianPimaPolishPortuguesePotawatomiPuebloPuerto RicanPuget Sound SalishRomanianRussianSalvadoranSamoanScandinavianScotch-IrishScottishSeminoleSenegaleseSerbianShoshoneSierra LeoneanSiouxSlavicSlovakSloveneSomaliSouth AfricanSouth AmericanSouth American IndianSoviet UnionSpaniardSpanishSpanish AmericanSpanish American IndianSri LankanSubsaharan AfricanSudaneseSwedishSwissSyrianTaiwaneseThaiTlingit-HaidaTohono O'OdhamTonganTrinidadian and TobagonianTsimshianTurkishU.S. Virgin IslanderUgandanUkrainianUruguayanUteVenezuelanVietnameseWelshWest IndianYakamaYaquiYugoslavianYumanYup'ikZimbabwean
Immigration
NonimmigrantsImmigrantsAfghanistanAfricaAlbaniaArgentinaArmeniaAsiaAustraliaAustriaBahamasBangladeshBarbadosBelarusBelgiumBelizeBoliviaBosnia and HerzegovinaBrazilBulgariaBurma/MyanmarCabo VerdeCambodiaCameroonCanadaCaribbeanCentral AmericaChileChinaColombiaCongoCosta RicaCroatiaCubaCzechoslovakiaDenmarkDominicaDominican RepublicEastern AfricaEastern AsiaEastern EuropeEcuadorEgyptEl SalvadorEnglandEritreaEthiopiaEuropeFijiFranceGermanyGhanaGreeceGrenadaGuatemalaGuyanaHaitiHondurasHong KongHungaryIndiaIndonesiaIranIraqIrelandIsraelItalyJamaicaJapanJordanKazakhstanKenyaKoreaKuwaitLaosLatin AmericaLatviaLebanonLiberiaLithuaniaMalaysiaMexicoMicronesiaMiddle AfricaMoldovaMoroccoNepalNetherlandsNicaraguaNigeriaNorth AmericaNorth MacedoniaNorthern AfricaNorthern EuropeNorwayOceaniaPakistanPanamaPeruPhilippinesPolandPortugalRomaniaRussiaSaudi ArabiaScotlandSenegalSerbiaSierra LeoneSingaporeSouth AfricaSouth AmericaSouth Central AsiaSouth Eastern AsiaSouthern EuropeSpainSri LankaSt. Vincent and the GrenadinesSudanSwedenSwitzerlandSyriaTaiwanThailandTrinidad and TobagoTurkeyUgandaUkraineUruguayUzbekistanVenezuelaVietnamWest IndiesWestern AfricaWestern AsiaWestern EuropeYemenZaireZimbabweAzores
Immigrants from Somalia
Race
Ancestry
AfghanAfricanAlaska NativeAlaskan AthabascanAlbanianAleutAlsatianAmericanApacheArabArapahoArgentineanArmenianAssyrian/Chaldean/SyriacAustralianAustrianBahamianBangladeshiBarbadianBasqueBelgianBelizeanBermudanBhutaneseBlackfeetBolivianBrazilianBritishBritish West IndianBulgarianBurmeseCajunCambodianCanadianCape VerdeanCarpatho RusynCelticCentral AmericanCentral American IndianCherokeeCheyenneChickasawChileanChineseChippewaChoctawColombianColvilleComancheCosta RicanCreeCreekCroatianCrowCubanCypriotCzechCzechoslovakianDanishDelawareDominicanDutchDutch West IndianEastern EuropeanEcuadorianEgyptianEnglishEstonianEthiopianEuropeanFijianFilipinoFinnishFrenchFrench American IndianFrench CanadianGermanGerman RussianGhanaianGreekGuamanian/ChamorroGuatemalanGuyaneseHaitianHmongHonduranHopiHoumaIcelanderIndian (Asian)IndonesianInupiatIranianIraqiIrishIroquoisIsraeliItalianJamaicanJapaneseJordanianKenyanKiowaKoreanLaotianLatvianLebaneseLiberianLithuanianLumbeeLuxembourgerMacedonianMalaysianMalteseMarshalleseMenomineeMexicanMexican American IndianMongolianMoroccanNative HawaiianNavajoNepaleseNew ZealanderNicaraguanNigerianNorthern EuropeanNorwegianOkinawanOsageOttawaPaiutePakistaniPalestinianPanamanianParaguayanPennsylvania GermanPeruvianPimaPolishPortuguesePotawatomiPuebloPuerto RicanPuget Sound SalishRomanianRussianSalvadoranSamoanScandinavianScotch-IrishScottishSeminoleSenegaleseSerbianShoshoneSierra LeoneanSiouxSlavicSlovakSloveneSomaliSouth AfricanSouth AmericanSouth American IndianSoviet UnionSpaniardSpanishSpanish AmericanSpanish American IndianSri LankanSubsaharan AfricanSudaneseSwedishSwissSyrianTaiwaneseThaiTlingit-HaidaTohono O'OdhamTonganTrinidadian and TobagonianTsimshianTurkishU.S. Virgin IslanderUgandanUkrainianUruguayanUteVenezuelanVietnameseWelshWest IndianYakamaYaquiYugoslavianYumanYup'ikZimbabwean
Immigration
NonimmigrantsImmigrantsAfghanistanAfricaAlbaniaArgentinaArmeniaAsiaAustraliaAustriaBahamasBangladeshBarbadosBelarusBelgiumBelizeBoliviaBosnia and HerzegovinaBrazilBulgariaBurma/MyanmarCabo VerdeCambodiaCameroonCanadaCaribbeanCentral AmericaChileChinaColombiaCongoCosta RicaCroatiaCubaCzechoslovakiaDenmarkDominicaDominican RepublicEastern AfricaEastern AsiaEastern EuropeEcuadorEgyptEl SalvadorEnglandEritreaEthiopiaEuropeFijiFranceGermanyGhanaGreeceGrenadaGuatemalaGuyanaHaitiHondurasHong KongHungaryIndiaIndonesiaIranIraqIrelandIsraelItalyJamaicaJapanJordanKazakhstanKenyaKoreaKuwaitLaosLatin AmericaLatviaLebanonLiberiaLithuaniaMalaysiaMexicoMicronesiaMiddle AfricaMoldovaMoroccoNepalNetherlandsNicaraguaNigeriaNorth AmericaNorth MacedoniaNorthern AfricaNorthern EuropeNorwayOceaniaPakistanPanamaPeruPhilippinesPolandPortugalRomaniaRussiaSaudi ArabiaScotlandSenegalSerbiaSierra LeoneSingaporeSomaliaSouth AfricaSouth AmericaSouth Central AsiaSouth Eastern AsiaSouthern EuropeSpainSri LankaSt. Vincent and the GrenadinesSudanSwedenSwitzerlandSyriaTaiwanThailandTrinidad and TobagoTurkeyUgandaUkraineUruguayUzbekistanVenezuelaVietnamWest IndiesWestern AfricaWestern AsiaWestern EuropeYemenZaireZimbabweAzores
Per Capita Income
Income
Poverty
Unemployment
Labor Participation
Family Structure
Vehicle Availability
Education Level
Disability

Per Capita Income Comparison

Hungarians

Immigrants from Somalia

Excellent
Tragic
$45,426
PER CAPITA INCOME
87.9/ 100
METRIC RATING
135th/ 347
METRIC RANK
$39,974
PER CAPITA INCOME
1.6/ 100
METRIC RATING
247th/ 347
METRIC RANK

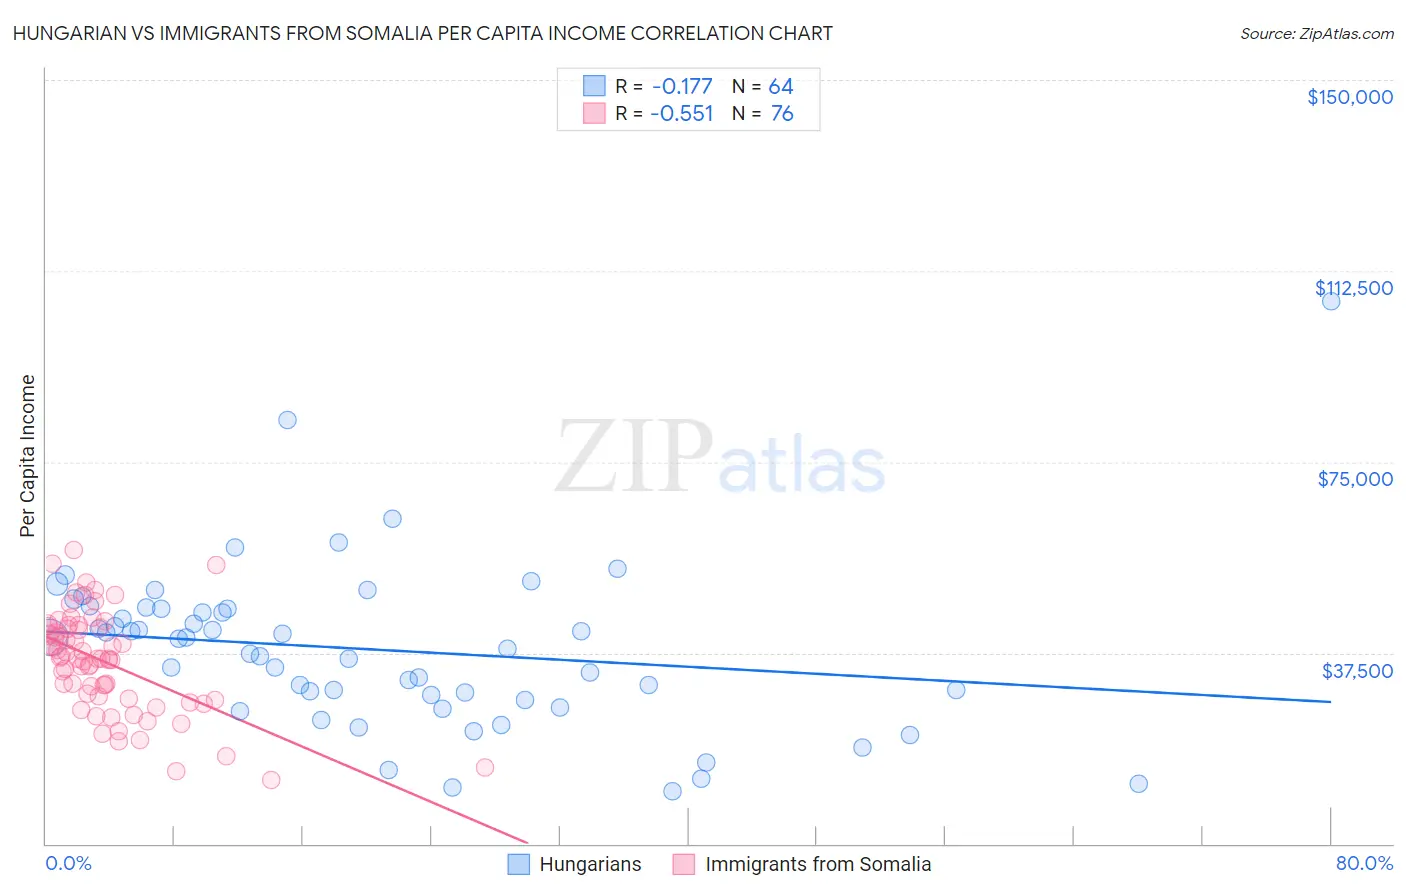
Hungarian vs Immigrants from Somalia Per Capita Income Correlation Chart

The statistical analysis conducted on geographies consisting of 486,270,132 people shows a poor negative correlation between the proportion of Hungarians and per capita income in the United States with a correlation coefficient (R) of -0.177 and weighted average of $45,426. Similarly, the statistical analysis conducted on geographies consisting of 92,111,755 people shows a substantial negative correlation between the proportion of Immigrants from Somalia and per capita income in the United States with a correlation coefficient (R) of -0.551 and weighted average of $39,974, a difference of 13.6%.
Hungarian vs Immigrants from Somalia Per Capita Income

Per Capita Income Correlation Summary

MeasurementHungarianImmigrants from Somalia
Minimum$10,415$12,576
Maximum$106,430$57,592
Range$96,015$45,016
Mean$38,150$35,739
Median$39,313$36,374
Interquartile 25% (IQ1)$28,777$28,746
Interquartile 75% (IQ3)$46,125$42,371
Interquartile Range (IQR)$17,348$13,624
Standard Deviation (Sample)$16,236$9,785
Standard Deviation (Population)$16,109$9,721

Similar Demographics by Per Capita Income

Demographics Similar to Hungarians by Per Capita Income

In terms of per capita income, the demographic groups most similar to Hungarians are Slovene ($45,581, a difference of 0.34%), Pakistani ($45,587, a difference of 0.35%), Jordanian ($45,605, a difference of 0.39%), Immigrants from North Macedonia ($45,622, a difference of 0.43%), and Immigrants from Oceania ($45,220, a difference of 0.46%).
DemographicsRating | RankPer Capita Income
Swedes
91.3
/100
|
#128
Exceptional
$45,750
Luxembourgers
90.4
/100
|
#129
Exceptional
$45,663
Arabs
90.4
/100
|
#130
Exceptional
$45,662
Immigrants | North Macedonia
90.0
/100
|
#131
Exceptional
$45,622
Jordanians
89.9
/100
|
#132
Excellent
$45,605
Pakistanis
89.7
/100
|
#133
Excellent
$45,587
Slovenes
89.6
/100
|
#134
Excellent
$45,581
Hungarians
87.9
/100
|
#135
Excellent
$45,426
Immigrants | Oceania
85.2
/100
|
#136
Excellent
$45,220
Immigrants | Syria
85.2
/100
|
#137
Excellent
$45,218
Assyrians/Chaldeans/Syriacs
84.8
/100
|
#138
Excellent
$45,195
Basques
83.2
/100
|
#139
Excellent
$45,086
Immigrants | Jordan
82.9
/100
|
#140
Excellent
$45,066
Slavs
82.6
/100
|
#141
Excellent
$45,049
Ugandans
82.6
/100
|
#142
Excellent
$45,047

Demographics Similar to Immigrants from Somalia by Per Capita Income

In terms of per capita income, the demographic groups most similar to Immigrants from Somalia are Cape Verdean ($39,935, a difference of 0.10%), Cree ($40,056, a difference of 0.20%), Japanese ($39,870, a difference of 0.26%), Immigrants from Burma/Myanmar ($39,827, a difference of 0.37%), and Samoan ($39,826, a difference of 0.37%).
DemographicsRating | RankPer Capita Income
Immigrants | Nigeria
2.3
/100
|
#240
Tragic
$40,339
British West Indians
2.3
/100
|
#241
Tragic
$40,330
Immigrants | Western Africa
2.2
/100
|
#242
Tragic
$40,294
German Russians
2.2
/100
|
#243
Tragic
$40,266
French American Indians
2.1
/100
|
#244
Tragic
$40,244
Sub-Saharan Africans
1.9
/100
|
#245
Tragic
$40,152
Cree
1.7
/100
|
#246
Tragic
$40,056
Immigrants | Somalia
1.6
/100
|
#247
Tragic
$39,974
Cape Verdeans
1.5
/100
|
#248
Tragic
$39,935
Japanese
1.4
/100
|
#249
Tragic
$39,870
Immigrants | Burma/Myanmar
1.3
/100
|
#250
Tragic
$39,827
Samoans
1.3
/100
|
#251
Tragic
$39,826
Immigrants | Azores
1.0
/100
|
#252
Tragic
$39,608
Osage
1.0
/100
|
#253
Tragic
$39,568
Alaska Natives
1.0
/100
|
#254
Tragic
$39,558