Hungarian vs Immigrants from Brazil Per Capita Income
COMPARE
Hungarian
Immigrants from Brazil
Per Capita Income
Per Capita Income Comparison
Hungarians
Immigrants from Brazil
$45,426
PER CAPITA INCOME
87.9/ 100
METRIC RATING
135th/ 347
METRIC RANK
$48,164
PER CAPITA INCOME
99.4/ 100
METRIC RATING
83rd/ 347
METRIC RANK
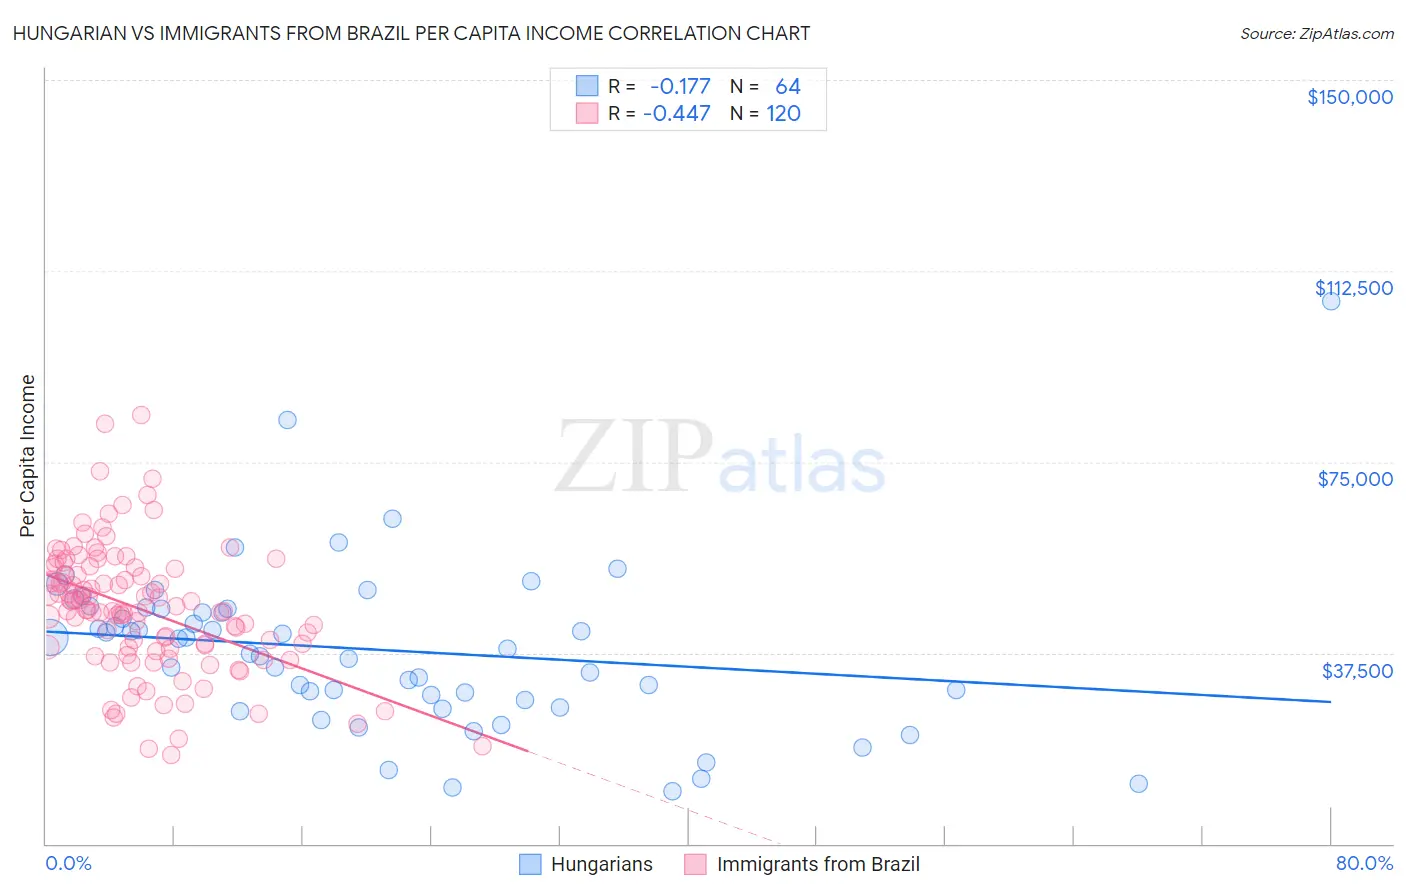
Hungarian vs Immigrants from Brazil Per Capita Income Correlation Chart
The statistical analysis conducted on geographies consisting of 486,270,132 people shows a poor negative correlation between the proportion of Hungarians and per capita income in the United States with a correlation coefficient (R) of -0.177 and weighted average of $45,426. Similarly, the statistical analysis conducted on geographies consisting of 343,026,133 people shows a moderate negative correlation between the proportion of Immigrants from Brazil and per capita income in the United States with a correlation coefficient (R) of -0.447 and weighted average of $48,164, a difference of 6.0%.
Per Capita Income Correlation Summary
| Measurement | Hungarian | Immigrants from Brazil |
| Minimum | $10,415 | $17,376 |
| Maximum | $106,430 | $84,094 |
| Range | $96,015 | $66,718 |
| Mean | $38,150 | $46,035 |
| Median | $39,313 | $45,902 |
| Interquartile 25% (IQ1) | $28,777 | $38,349 |
| Interquartile 75% (IQ3) | $46,125 | $54,171 |
| Interquartile Range (IQR) | $17,348 | $15,822 |
| Standard Deviation (Sample) | $16,236 | $12,485 |
| Standard Deviation (Population) | $16,109 | $12,433 |
Similar Demographics by Per Capita Income
Demographics Similar to Hungarians by Per Capita Income
In terms of per capita income, the demographic groups most similar to Hungarians are Slovene ($45,581, a difference of 0.34%), Pakistani ($45,587, a difference of 0.35%), Jordanian ($45,605, a difference of 0.39%), Immigrants from North Macedonia ($45,622, a difference of 0.43%), and Immigrants from Oceania ($45,220, a difference of 0.46%).
| Demographics | Rating | Rank | Per Capita Income |
| Swedes | 91.3 /100 | #128 | Exceptional $45,750 |
| Luxembourgers | 90.4 /100 | #129 | Exceptional $45,663 |
| Arabs | 90.4 /100 | #130 | Exceptional $45,662 |
| Immigrants | North Macedonia | 90.0 /100 | #131 | Exceptional $45,622 |
| Jordanians | 89.9 /100 | #132 | Excellent $45,605 |
| Pakistanis | 89.7 /100 | #133 | Excellent $45,587 |
| Slovenes | 89.6 /100 | #134 | Excellent $45,581 |
| Hungarians | 87.9 /100 | #135 | Excellent $45,426 |
| Immigrants | Oceania | 85.2 /100 | #136 | Excellent $45,220 |
| Immigrants | Syria | 85.2 /100 | #137 | Excellent $45,218 |
| Assyrians/Chaldeans/Syriacs | 84.8 /100 | #138 | Excellent $45,195 |
| Basques | 83.2 /100 | #139 | Excellent $45,086 |
| Immigrants | Jordan | 82.9 /100 | #140 | Excellent $45,066 |
| Slavs | 82.6 /100 | #141 | Excellent $45,049 |
| Ugandans | 82.6 /100 | #142 | Excellent $45,047 |
Demographics Similar to Immigrants from Brazil by Per Capita Income
In terms of per capita income, the demographic groups most similar to Immigrants from Brazil are Immigrants from Indonesia ($48,195, a difference of 0.060%), Immigrants from Ukraine ($48,134, a difference of 0.060%), Austrian ($48,116, a difference of 0.10%), Armenian ($48,287, a difference of 0.26%), and Immigrants from Southern Europe ($48,027, a difference of 0.29%).
| Demographics | Rating | Rank | Per Capita Income |
| Immigrants | England | 99.7 /100 | #76 | Exceptional $48,844 |
| Immigrants | Kazakhstan | 99.7 /100 | #77 | Exceptional $48,747 |
| Immigrants | Italy | 99.6 /100 | #78 | Exceptional $48,654 |
| Romanians | 99.5 /100 | #79 | Exceptional $48,445 |
| Egyptians | 99.5 /100 | #80 | Exceptional $48,358 |
| Armenians | 99.4 /100 | #81 | Exceptional $48,287 |
| Immigrants | Indonesia | 99.4 /100 | #82 | Exceptional $48,195 |
| Immigrants | Brazil | 99.4 /100 | #83 | Exceptional $48,164 |
| Immigrants | Ukraine | 99.3 /100 | #84 | Exceptional $48,134 |
| Austrians | 99.3 /100 | #85 | Exceptional $48,116 |
| Immigrants | Southern Europe | 99.3 /100 | #86 | Exceptional $48,027 |
| Ukrainians | 99.3 /100 | #87 | Exceptional $48,014 |
| Croatians | 99.0 /100 | #88 | Exceptional $47,742 |
| Northern Europeans | 98.9 /100 | #89 | Exceptional $47,698 |
| Italians | 98.8 /100 | #90 | Exceptional $47,574 |