Hungarian vs Immigrants from Ecuador Per Capita Income
COMPARE
Hungarian
Immigrants from Ecuador
Per Capita Income
Per Capita Income Comparison
Hungarians
Immigrants from Ecuador
$45,426
PER CAPITA INCOME
87.9/ 100
METRIC RATING
135th/ 347
METRIC RANK
$41,195
PER CAPITA INCOME
5.9/ 100
METRIC RATING
226th/ 347
METRIC RANK
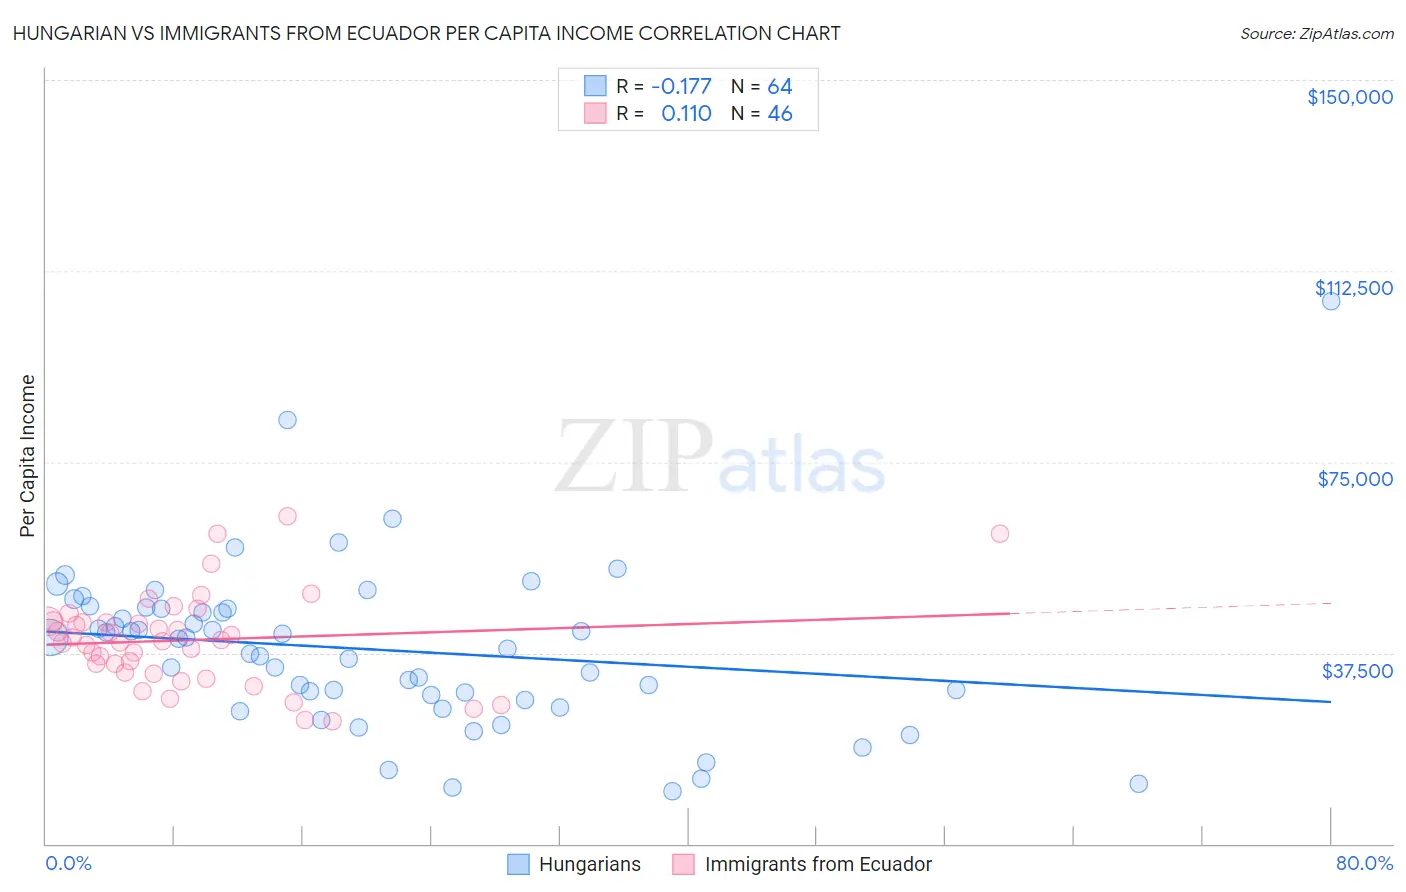
Hungarian vs Immigrants from Ecuador Per Capita Income Correlation Chart
The statistical analysis conducted on geographies consisting of 486,270,132 people shows a poor negative correlation between the proportion of Hungarians and per capita income in the United States with a correlation coefficient (R) of -0.177 and weighted average of $45,426. Similarly, the statistical analysis conducted on geographies consisting of 271,002,602 people shows a poor positive correlation between the proportion of Immigrants from Ecuador and per capita income in the United States with a correlation coefficient (R) of 0.110 and weighted average of $41,195, a difference of 10.3%.
Per Capita Income Correlation Summary
| Measurement | Hungarian | Immigrants from Ecuador |
| Minimum | $10,415 | $24,078 |
| Maximum | $106,430 | $64,385 |
| Range | $96,015 | $40,307 |
| Mean | $38,150 | $40,002 |
| Median | $39,313 | $39,852 |
| Interquartile 25% (IQ1) | $28,777 | $33,648 |
| Interquartile 75% (IQ3) | $46,125 | $43,627 |
| Interquartile Range (IQR) | $17,348 | $9,979 |
| Standard Deviation (Sample) | $16,236 | $9,075 |
| Standard Deviation (Population) | $16,109 | $8,976 |
Similar Demographics by Per Capita Income
Demographics Similar to Hungarians by Per Capita Income
In terms of per capita income, the demographic groups most similar to Hungarians are Slovene ($45,581, a difference of 0.34%), Pakistani ($45,587, a difference of 0.35%), Jordanian ($45,605, a difference of 0.39%), Immigrants from North Macedonia ($45,622, a difference of 0.43%), and Immigrants from Oceania ($45,220, a difference of 0.46%).
| Demographics | Rating | Rank | Per Capita Income |
| Swedes | 91.3 /100 | #128 | Exceptional $45,750 |
| Luxembourgers | 90.4 /100 | #129 | Exceptional $45,663 |
| Arabs | 90.4 /100 | #130 | Exceptional $45,662 |
| Immigrants | North Macedonia | 90.0 /100 | #131 | Exceptional $45,622 |
| Jordanians | 89.9 /100 | #132 | Excellent $45,605 |
| Pakistanis | 89.7 /100 | #133 | Excellent $45,587 |
| Slovenes | 89.6 /100 | #134 | Excellent $45,581 |
| Hungarians | 87.9 /100 | #135 | Excellent $45,426 |
| Immigrants | Oceania | 85.2 /100 | #136 | Excellent $45,220 |
| Immigrants | Syria | 85.2 /100 | #137 | Excellent $45,218 |
| Assyrians/Chaldeans/Syriacs | 84.8 /100 | #138 | Excellent $45,195 |
| Basques | 83.2 /100 | #139 | Excellent $45,086 |
| Immigrants | Jordan | 82.9 /100 | #140 | Excellent $45,066 |
| Slavs | 82.6 /100 | #141 | Excellent $45,049 |
| Ugandans | 82.6 /100 | #142 | Excellent $45,047 |
Demographics Similar to Immigrants from Ecuador by Per Capita Income
In terms of per capita income, the demographic groups most similar to Immigrants from Ecuador are West Indian ($41,217, a difference of 0.050%), Immigrants from Ghana ($41,131, a difference of 0.16%), Immigrants from Grenada ($41,123, a difference of 0.17%), Immigrants from St. Vincent and the Grenadines ($41,270, a difference of 0.18%), and Immigrants from Cameroon ($41,334, a difference of 0.34%).
| Demographics | Rating | Rank | Per Capita Income |
| Puget Sound Salish | 8.1 /100 | #219 | Tragic $41,495 |
| Immigrants | Barbados | 7.9 /100 | #220 | Tragic $41,478 |
| Immigrants | Trinidad and Tobago | 7.9 /100 | #221 | Tragic $41,476 |
| Immigrants | Iraq | 7.1 /100 | #222 | Tragic $41,365 |
| Immigrants | Cameroon | 6.8 /100 | #223 | Tragic $41,334 |
| Immigrants | St. Vincent and the Grenadines | 6.4 /100 | #224 | Tragic $41,270 |
| West Indians | 6.0 /100 | #225 | Tragic $41,217 |
| Immigrants | Ecuador | 5.9 /100 | #226 | Tragic $41,195 |
| Immigrants | Ghana | 5.5 /100 | #227 | Tragic $41,131 |
| Immigrants | Grenada | 5.5 /100 | #228 | Tragic $41,123 |
| Nigerians | 4.9 /100 | #229 | Tragic $41,026 |
| Native Hawaiians | 4.9 /100 | #230 | Tragic $41,017 |
| Senegalese | 4.8 /100 | #231 | Tragic $41,000 |
| Guyanese | 4.5 /100 | #232 | Tragic $40,949 |
| Delaware | 3.8 /100 | #233 | Tragic $40,778 |