Hungarian vs Immigrants from Serbia Per Capita Income
COMPARE
Hungarian
Immigrants from Serbia
Per Capita Income
Per Capita Income Comparison
Hungarians
Immigrants from Serbia
$45,426
PER CAPITA INCOME
87.9/ 100
METRIC RATING
135th/ 347
METRIC RANK
$50,810
PER CAPITA INCOME
100.0/ 100
METRIC RATING
48th/ 347
METRIC RANK
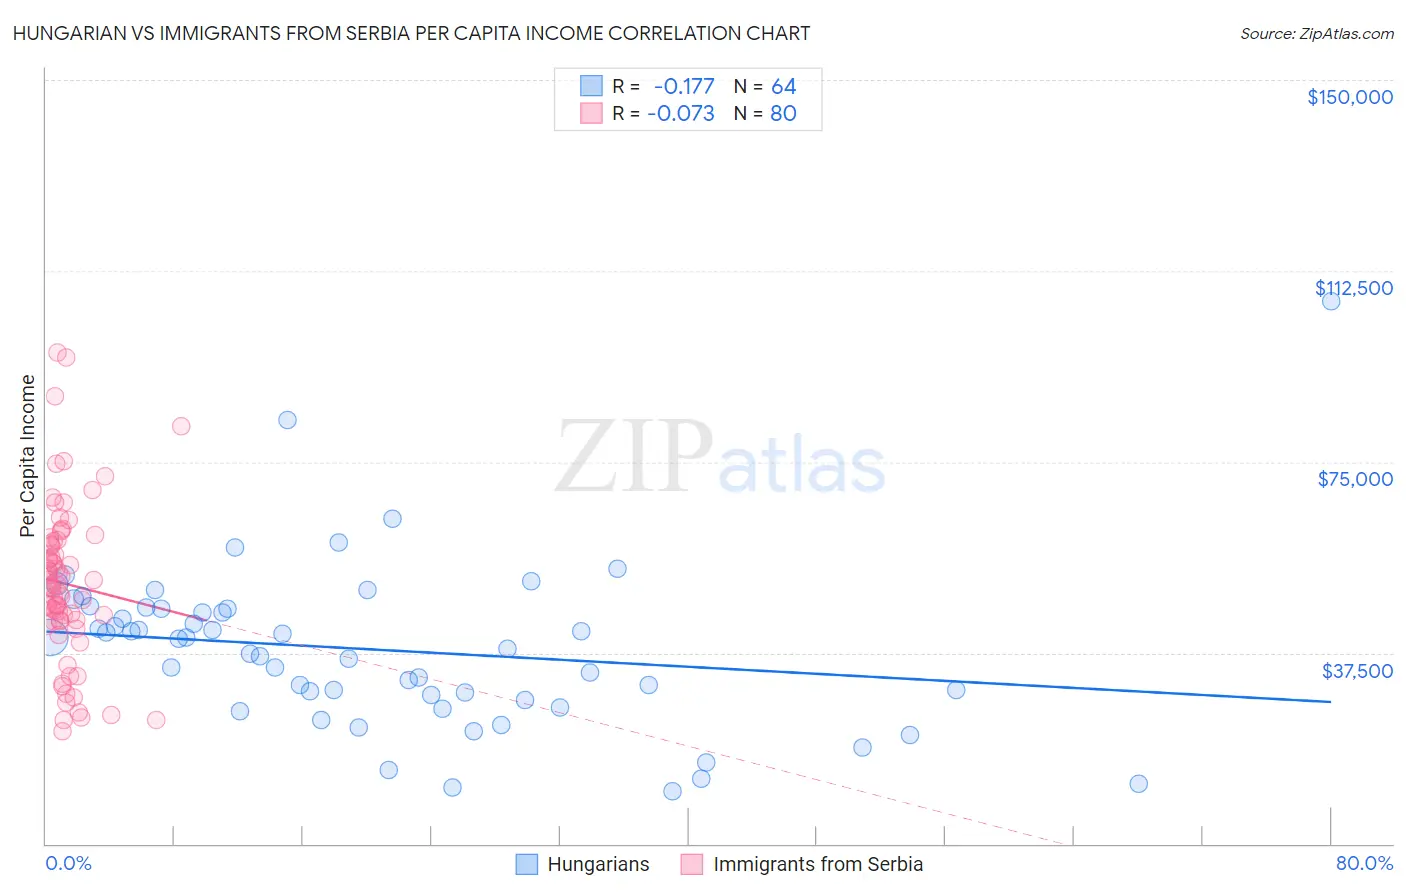
Hungarian vs Immigrants from Serbia Per Capita Income Correlation Chart
The statistical analysis conducted on geographies consisting of 486,270,132 people shows a poor negative correlation between the proportion of Hungarians and per capita income in the United States with a correlation coefficient (R) of -0.177 and weighted average of $45,426. Similarly, the statistical analysis conducted on geographies consisting of 131,748,543 people shows a slight negative correlation between the proportion of Immigrants from Serbia and per capita income in the United States with a correlation coefficient (R) of -0.073 and weighted average of $50,810, a difference of 11.8%.
Per Capita Income Correlation Summary
| Measurement | Hungarian | Immigrants from Serbia |
| Minimum | $10,415 | $22,149 |
| Maximum | $106,430 | $96,565 |
| Range | $96,015 | $74,416 |
| Mean | $38,150 | $51,095 |
| Median | $39,313 | $50,532 |
| Interquartile 25% (IQ1) | $28,777 | $43,814 |
| Interquartile 75% (IQ3) | $46,125 | $59,208 |
| Interquartile Range (IQR) | $17,348 | $15,394 |
| Standard Deviation (Sample) | $16,236 | $15,421 |
| Standard Deviation (Population) | $16,109 | $15,324 |
Similar Demographics by Per Capita Income
Demographics Similar to Hungarians by Per Capita Income
In terms of per capita income, the demographic groups most similar to Hungarians are Slovene ($45,581, a difference of 0.34%), Pakistani ($45,587, a difference of 0.35%), Jordanian ($45,605, a difference of 0.39%), Immigrants from North Macedonia ($45,622, a difference of 0.43%), and Immigrants from Oceania ($45,220, a difference of 0.46%).
| Demographics | Rating | Rank | Per Capita Income |
| Swedes | 91.3 /100 | #128 | Exceptional $45,750 |
| Luxembourgers | 90.4 /100 | #129 | Exceptional $45,663 |
| Arabs | 90.4 /100 | #130 | Exceptional $45,662 |
| Immigrants | North Macedonia | 90.0 /100 | #131 | Exceptional $45,622 |
| Jordanians | 89.9 /100 | #132 | Excellent $45,605 |
| Pakistanis | 89.7 /100 | #133 | Excellent $45,587 |
| Slovenes | 89.6 /100 | #134 | Excellent $45,581 |
| Hungarians | 87.9 /100 | #135 | Excellent $45,426 |
| Immigrants | Oceania | 85.2 /100 | #136 | Excellent $45,220 |
| Immigrants | Syria | 85.2 /100 | #137 | Excellent $45,218 |
| Assyrians/Chaldeans/Syriacs | 84.8 /100 | #138 | Excellent $45,195 |
| Basques | 83.2 /100 | #139 | Excellent $45,086 |
| Immigrants | Jordan | 82.9 /100 | #140 | Excellent $45,066 |
| Slavs | 82.6 /100 | #141 | Excellent $45,049 |
| Ugandans | 82.6 /100 | #142 | Excellent $45,047 |
Demographics Similar to Immigrants from Serbia by Per Capita Income
In terms of per capita income, the demographic groups most similar to Immigrants from Serbia are Bulgarian ($50,906, a difference of 0.19%), Immigrants from Latvia ($50,914, a difference of 0.21%), Immigrants from Spain ($50,933, a difference of 0.24%), Immigrants from Europe ($50,950, a difference of 0.28%), and New Zealander ($50,575, a difference of 0.46%).
| Demographics | Rating | Rank | Per Capita Income |
| Immigrants | South Africa | 100.0 /100 | #41 | Exceptional $51,465 |
| Immigrants | Turkey | 100.0 /100 | #42 | Exceptional $51,368 |
| Immigrants | Lithuania | 100.0 /100 | #43 | Exceptional $51,361 |
| Immigrants | Europe | 100.0 /100 | #44 | Exceptional $50,950 |
| Immigrants | Spain | 100.0 /100 | #45 | Exceptional $50,933 |
| Immigrants | Latvia | 100.0 /100 | #46 | Exceptional $50,914 |
| Bulgarians | 100.0 /100 | #47 | Exceptional $50,906 |
| Immigrants | Serbia | 100.0 /100 | #48 | Exceptional $50,810 |
| New Zealanders | 100.0 /100 | #49 | Exceptional $50,575 |
| Immigrants | Sri Lanka | 100.0 /100 | #50 | Exceptional $50,555 |
| Immigrants | Netherlands | 100.0 /100 | #51 | Exceptional $50,458 |
| Immigrants | Croatia | 99.9 /100 | #52 | Exceptional $50,417 |
| Paraguayans | 99.9 /100 | #53 | Exceptional $50,385 |
| Immigrants | Belarus | 99.9 /100 | #54 | Exceptional $50,303 |
| Immigrants | Western Europe | 99.9 /100 | #55 | Exceptional $50,065 |