Houma vs Immigrants from Hong Kong Median Female Earnings
COMPARE
Houma
Immigrants from Hong Kong
Median Female Earnings
Median Female Earnings Comparison
Houma
Immigrants from Hong Kong
$30,343
MEDIAN FEMALE EARNINGS
0.0/ 100
METRIC RATING
347th/ 347
METRIC RANK
$49,818
MEDIAN FEMALE EARNINGS
100.0/ 100
METRIC RATING
1st/ 347
METRIC RANK
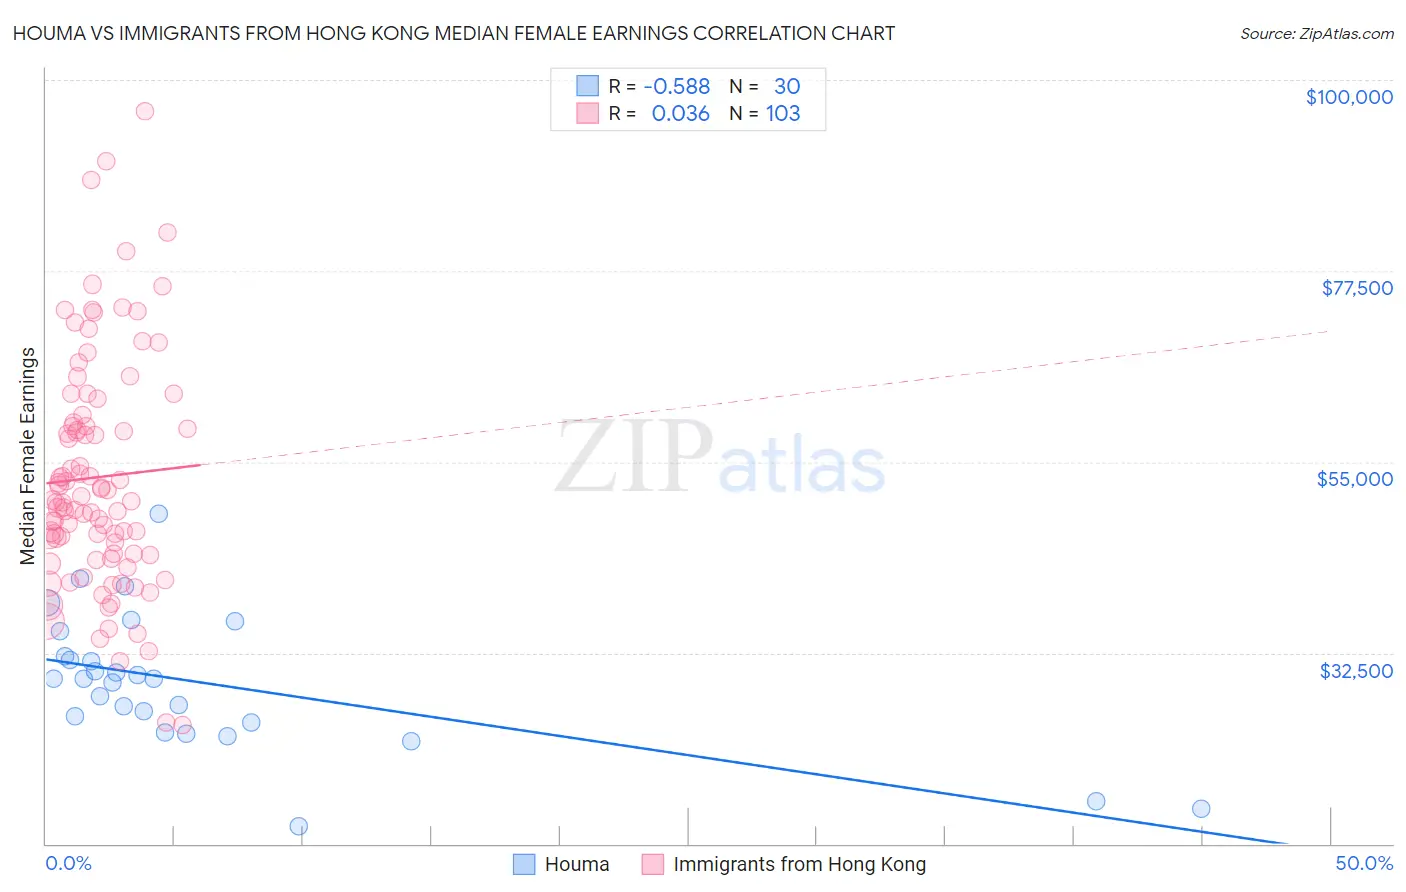
Houma vs Immigrants from Hong Kong Median Female Earnings Correlation Chart
The statistical analysis conducted on geographies consisting of 36,795,297 people shows a substantial negative correlation between the proportion of Houma and median female earnings in the United States with a correlation coefficient (R) of -0.588 and weighted average of $30,343. Similarly, the statistical analysis conducted on geographies consisting of 253,932,744 people shows no correlation between the proportion of Immigrants from Hong Kong and median female earnings in the United States with a correlation coefficient (R) of 0.036 and weighted average of $49,818, a difference of 64.2%.
Median Female Earnings Correlation Summary
| Measurement | Houma | Immigrants from Hong Kong |
| Minimum | $12,038 | $24,038 |
| Maximum | $48,900 | $96,250 |
| Range | $36,862 | $72,212 |
| Mean | $28,868 | $53,195 |
| Median | $29,403 | $50,354 |
| Interquartile 25% (IQ1) | $24,292 | $44,209 |
| Interquartile 75% (IQ3) | $32,114 | $59,618 |
| Interquartile Range (IQR) | $7,822 | $15,409 |
| Standard Deviation (Sample) | $8,016 | $13,646 |
| Standard Deviation (Population) | $7,881 | $13,580 |
Similar Demographics by Median Female Earnings
Demographics Similar to Houma by Median Female Earnings
In terms of median female earnings, the demographic groups most similar to Houma are Arapaho ($31,489, a difference of 3.8%), Puerto Rican ($31,560, a difference of 4.0%), Lumbee ($32,500, a difference of 7.1%), Pueblo ($32,564, a difference of 7.3%), and Yup'ik ($32,730, a difference of 7.9%).
| Demographics | Rating | Rank | Median Female Earnings |
| Mexicans | 0.0 /100 | #333 | Tragic $33,664 |
| Spanish American Indians | 0.0 /100 | #334 | Tragic $33,625 |
| Creek | 0.0 /100 | #335 | Tragic $33,437 |
| Ottawa | 0.0 /100 | #336 | Tragic $33,378 |
| Yakama | 0.0 /100 | #337 | Tragic $33,354 |
| Immigrants | Cuba | 0.0 /100 | #338 | Tragic $33,291 |
| Immigrants | Mexico | 0.0 /100 | #339 | Tragic $33,236 |
| Tohono O'odham | 0.0 /100 | #340 | Tragic $33,205 |
| Navajo | 0.0 /100 | #341 | Tragic $33,046 |
| Yup'ik | 0.0 /100 | #342 | Tragic $32,730 |
| Pueblo | 0.0 /100 | #343 | Tragic $32,564 |
| Lumbee | 0.0 /100 | #344 | Tragic $32,500 |
| Puerto Ricans | 0.0 /100 | #345 | Tragic $31,560 |
| Arapaho | 0.0 /100 | #346 | Tragic $31,489 |
| Houma | 0.0 /100 | #347 | Tragic $30,343 |
Demographics Similar to Immigrants from Hong Kong by Median Female Earnings
In terms of median female earnings, the demographic groups most similar to Immigrants from Hong Kong are Filipino ($49,508, a difference of 0.63%), Immigrants from Taiwan ($49,256, a difference of 1.1%), Immigrants from India ($48,292, a difference of 3.2%), Immigrants from Singapore ($47,986, a difference of 3.8%), and Immigrants from Ireland ($47,598, a difference of 4.7%).
| Demographics | Rating | Rank | Median Female Earnings |
| Immigrants | Hong Kong | 100.0 /100 | #1 | Exceptional $49,818 |
| Filipinos | 100.0 /100 | #2 | Exceptional $49,508 |
| Immigrants | Taiwan | 100.0 /100 | #3 | Exceptional $49,256 |
| Immigrants | India | 100.0 /100 | #4 | Exceptional $48,292 |
| Immigrants | Singapore | 100.0 /100 | #5 | Exceptional $47,986 |
| Immigrants | Ireland | 100.0 /100 | #6 | Exceptional $47,598 |
| Thais | 100.0 /100 | #7 | Exceptional $47,577 |
| Iranians | 100.0 /100 | #8 | Exceptional $47,421 |
| Immigrants | Iran | 100.0 /100 | #9 | Exceptional $47,154 |
| Immigrants | China | 100.0 /100 | #10 | Exceptional $46,972 |
| Okinawans | 100.0 /100 | #11 | Exceptional $46,905 |
| Immigrants | Israel | 100.0 /100 | #12 | Exceptional $46,902 |
| Immigrants | Australia | 100.0 /100 | #13 | Exceptional $46,573 |
| Soviet Union | 100.0 /100 | #14 | Exceptional $46,556 |
| Immigrants | Eastern Asia | 100.0 /100 | #15 | Exceptional $46,502 |