Houma vs Hispanic or Latino Median Female Earnings
COMPARE
Houma
Hispanic or Latino
Median Female Earnings
Median Female Earnings Comparison
Houma
Hispanics or Latinos
$30,343
MEDIAN FEMALE EARNINGS
0.0/ 100
METRIC RATING
347th/ 347
METRIC RANK
$34,421
MEDIAN FEMALE EARNINGS
0.0/ 100
METRIC RATING
321st/ 347
METRIC RANK
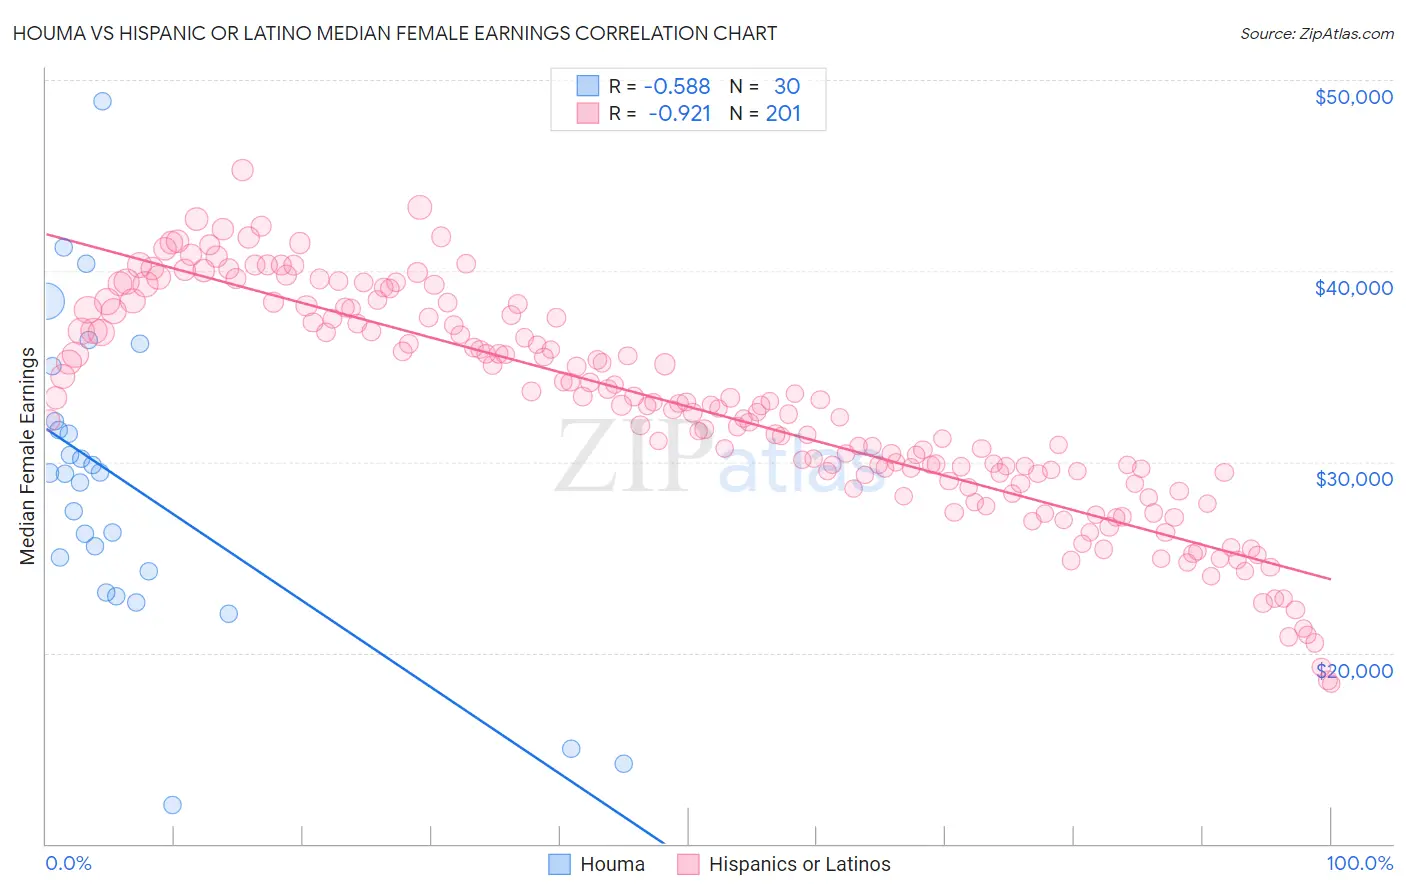
Houma vs Hispanic or Latino Median Female Earnings Correlation Chart
The statistical analysis conducted on geographies consisting of 36,795,297 people shows a substantial negative correlation between the proportion of Houma and median female earnings in the United States with a correlation coefficient (R) of -0.588 and weighted average of $30,343. Similarly, the statistical analysis conducted on geographies consisting of 576,408,721 people shows a near-perfect negative correlation between the proportion of Hispanics or Latinos and median female earnings in the United States with a correlation coefficient (R) of -0.921 and weighted average of $34,421, a difference of 13.4%.
Median Female Earnings Correlation Summary
| Measurement | Houma | Hispanic or Latino |
| Minimum | $12,038 | $18,390 |
| Maximum | $48,900 | $45,279 |
| Range | $36,862 | $26,890 |
| Mean | $28,868 | $32,838 |
| Median | $29,403 | $32,964 |
| Interquartile 25% (IQ1) | $24,292 | $29,181 |
| Interquartile 75% (IQ3) | $32,114 | $37,606 |
| Interquartile Range (IQR) | $7,822 | $8,426 |
| Standard Deviation (Sample) | $8,016 | $5,710 |
| Standard Deviation (Population) | $7,881 | $5,696 |
Similar Demographics by Median Female Earnings
Demographics Similar to Houma by Median Female Earnings
In terms of median female earnings, the demographic groups most similar to Houma are Arapaho ($31,489, a difference of 3.8%), Puerto Rican ($31,560, a difference of 4.0%), Lumbee ($32,500, a difference of 7.1%), Pueblo ($32,564, a difference of 7.3%), and Yup'ik ($32,730, a difference of 7.9%).
| Demographics | Rating | Rank | Median Female Earnings |
| Mexicans | 0.0 /100 | #333 | Tragic $33,664 |
| Spanish American Indians | 0.0 /100 | #334 | Tragic $33,625 |
| Creek | 0.0 /100 | #335 | Tragic $33,437 |
| Ottawa | 0.0 /100 | #336 | Tragic $33,378 |
| Yakama | 0.0 /100 | #337 | Tragic $33,354 |
| Immigrants | Cuba | 0.0 /100 | #338 | Tragic $33,291 |
| Immigrants | Mexico | 0.0 /100 | #339 | Tragic $33,236 |
| Tohono O'odham | 0.0 /100 | #340 | Tragic $33,205 |
| Navajo | 0.0 /100 | #341 | Tragic $33,046 |
| Yup'ik | 0.0 /100 | #342 | Tragic $32,730 |
| Pueblo | 0.0 /100 | #343 | Tragic $32,564 |
| Lumbee | 0.0 /100 | #344 | Tragic $32,500 |
| Puerto Ricans | 0.0 /100 | #345 | Tragic $31,560 |
| Arapaho | 0.0 /100 | #346 | Tragic $31,489 |
| Houma | 0.0 /100 | #347 | Tragic $30,343 |
Demographics Similar to Hispanics or Latinos by Median Female Earnings
In terms of median female earnings, the demographic groups most similar to Hispanics or Latinos are Chickasaw ($34,414, a difference of 0.020%), Seminole ($34,385, a difference of 0.11%), Immigrants from Congo ($34,317, a difference of 0.31%), Immigrants from Honduras ($34,647, a difference of 0.66%), and Shoshone ($34,677, a difference of 0.74%).
| Demographics | Rating | Rank | Median Female Earnings |
| Apache | 0.0 /100 | #314 | Tragic $34,895 |
| Pennsylvania Germans | 0.0 /100 | #315 | Tragic $34,802 |
| Cherokee | 0.0 /100 | #316 | Tragic $34,742 |
| Potawatomi | 0.0 /100 | #317 | Tragic $34,739 |
| Immigrants | Yemen | 0.0 /100 | #318 | Tragic $34,693 |
| Shoshone | 0.0 /100 | #319 | Tragic $34,677 |
| Immigrants | Honduras | 0.0 /100 | #320 | Tragic $34,647 |
| Hispanics or Latinos | 0.0 /100 | #321 | Tragic $34,421 |
| Chickasaw | 0.0 /100 | #322 | Tragic $34,414 |
| Seminole | 0.0 /100 | #323 | Tragic $34,385 |
| Immigrants | Congo | 0.0 /100 | #324 | Tragic $34,317 |
| Dutch West Indians | 0.0 /100 | #325 | Tragic $34,106 |
| Kiowa | 0.0 /100 | #326 | Tragic $34,074 |
| Cajuns | 0.0 /100 | #327 | Tragic $34,034 |
| Immigrants | Central America | 0.0 /100 | #328 | Tragic $33,953 |