Houma vs Immigrants from Hong Kong Divorced or Separated
COMPARE
Houma
Immigrants from Hong Kong
Divorced or Separated
Divorced or Separated Comparison
Houma
Immigrants from Hong Kong
13.6%
DIVORCED OR SEPARATED
0.0/ 100
METRIC RATING
329th/ 347
METRIC RANK
10.0%
DIVORCED OR SEPARATED
100.0/ 100
METRIC RATING
3rd/ 347
METRIC RANK
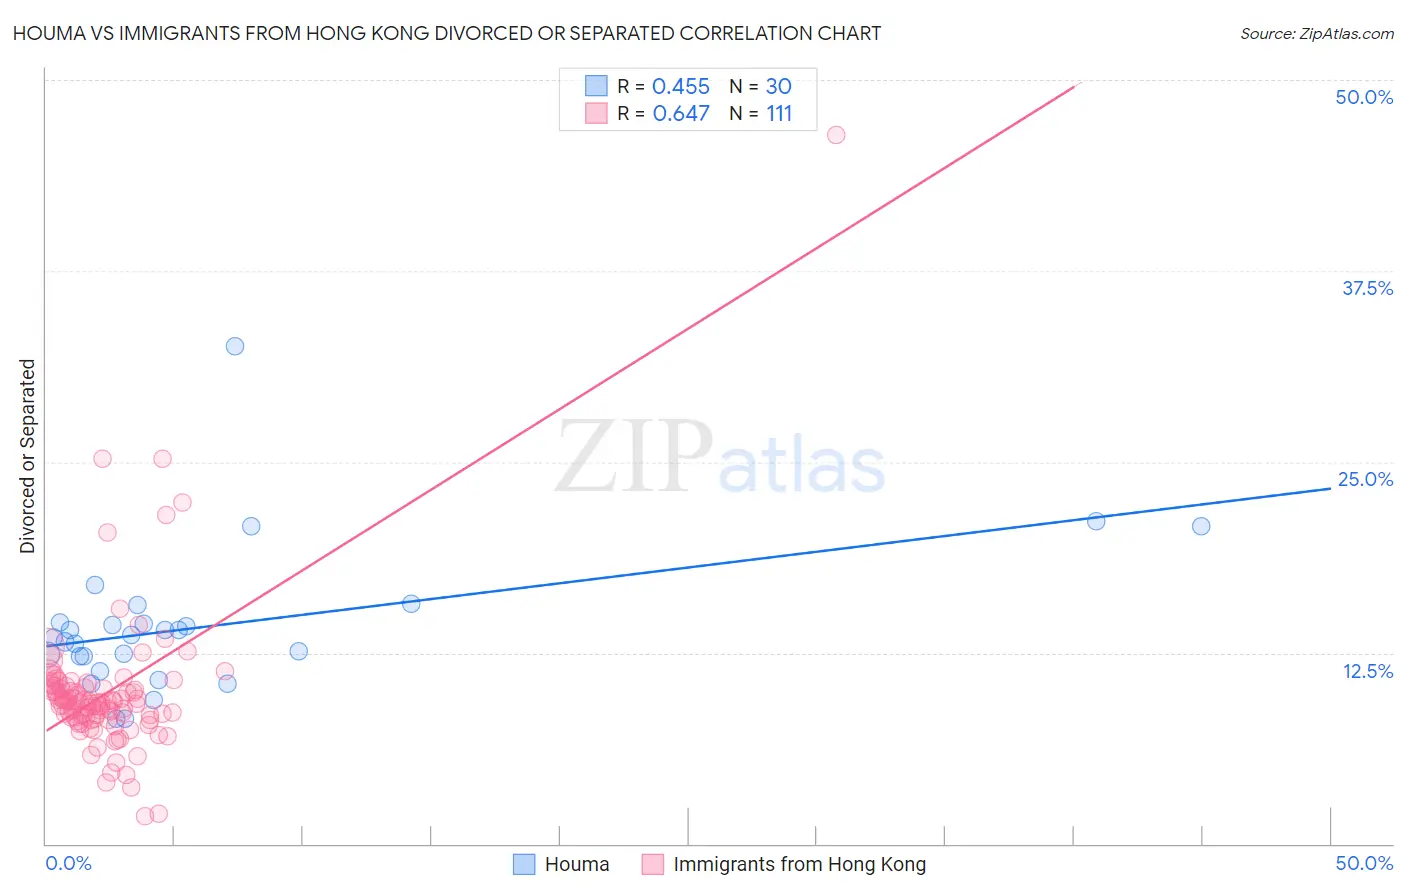
Houma vs Immigrants from Hong Kong Divorced or Separated Correlation Chart
The statistical analysis conducted on geographies consisting of 36,793,405 people shows a moderate positive correlation between the proportion of Houma and percentage of population currently divorced or separated in the United States with a correlation coefficient (R) of 0.455 and weighted average of 13.6%. Similarly, the statistical analysis conducted on geographies consisting of 253,935,113 people shows a significant positive correlation between the proportion of Immigrants from Hong Kong and percentage of population currently divorced or separated in the United States with a correlation coefficient (R) of 0.647 and weighted average of 10.0%, a difference of 36.4%.
Divorced or Separated Correlation Summary
| Measurement | Houma | Immigrants from Hong Kong |
| Minimum | 8.2% | 1.8% |
| Maximum | 32.6% | 46.4% |
| Range | 24.4% | 44.6% |
| Mean | 14.2% | 9.9% |
| Median | 13.6% | 9.2% |
| Interquartile 25% (IQ1) | 12.3% | 8.2% |
| Interquartile 75% (IQ3) | 14.5% | 10.2% |
| Interquartile Range (IQR) | 2.2% | 2.0% |
| Standard Deviation (Sample) | 4.7% | 5.0% |
| Standard Deviation (Population) | 4.6% | 5.0% |
Similar Demographics by Divorced or Separated
Demographics Similar to Houma by Divorced or Separated
In terms of divorced or separated, the demographic groups most similar to Houma are Paiute (13.6%, a difference of 0.11%), Immigrants from Caribbean (13.6%, a difference of 0.15%), Black/African American (13.6%, a difference of 0.24%), Comanche (13.5%, a difference of 0.53%), and Cherokee (13.7%, a difference of 1.0%).
| Demographics | Rating | Rank | Divorced or Separated |
| Immigrants | Haiti | 0.0 /100 | #322 | Tragic 13.4% |
| U.S. Virgin Islanders | 0.0 /100 | #323 | Tragic 13.4% |
| Osage | 0.0 /100 | #324 | Tragic 13.4% |
| Potawatomi | 0.0 /100 | #325 | Tragic 13.5% |
| Immigrants | Congo | 0.0 /100 | #326 | Tragic 13.5% |
| Comanche | 0.0 /100 | #327 | Tragic 13.5% |
| Immigrants | Caribbean | 0.0 /100 | #328 | Tragic 13.6% |
| Houma | 0.0 /100 | #329 | Tragic 13.6% |
| Paiute | 0.0 /100 | #330 | Tragic 13.6% |
| Blacks/African Americans | 0.0 /100 | #331 | Tragic 13.6% |
| Cherokee | 0.0 /100 | #332 | Tragic 13.7% |
| Puerto Ricans | 0.0 /100 | #333 | Tragic 13.9% |
| Immigrants | Bahamas | 0.0 /100 | #334 | Tragic 13.9% |
| Dutch West Indians | 0.0 /100 | #335 | Tragic 14.0% |
| Shoshone | 0.0 /100 | #336 | Tragic 14.0% |
Demographics Similar to Immigrants from Hong Kong by Divorced or Separated
In terms of divorced or separated, the demographic groups most similar to Immigrants from Hong Kong are Filipino (9.9%, a difference of 0.56%), Immigrants from China (10.0%, a difference of 0.72%), Immigrants from India (10.1%, a difference of 0.96%), Immigrants from Taiwan (9.8%, a difference of 1.6%), and Indian (Asian) (10.2%, a difference of 2.3%).
| Demographics | Rating | Rank | Divorced or Separated |
| Immigrants | Taiwan | 100.0 /100 | #1 | Exceptional 9.8% |
| Filipinos | 100.0 /100 | #2 | Exceptional 9.9% |
| Immigrants | Hong Kong | 100.0 /100 | #3 | Exceptional 10.0% |
| Immigrants | China | 100.0 /100 | #4 | Exceptional 10.0% |
| Immigrants | India | 100.0 /100 | #5 | Exceptional 10.1% |
| Indians (Asian) | 100.0 /100 | #6 | Exceptional 10.2% |
| Thais | 100.0 /100 | #7 | Exceptional 10.2% |
| Immigrants | Eastern Asia | 100.0 /100 | #8 | Exceptional 10.2% |
| Yup'ik | 100.0 /100 | #9 | Exceptional 10.3% |
| Immigrants | Singapore | 100.0 /100 | #10 | Exceptional 10.3% |
| Immigrants | South Central Asia | 100.0 /100 | #11 | Exceptional 10.4% |
| Okinawans | 100.0 /100 | #12 | Exceptional 10.5% |
| Cypriots | 100.0 /100 | #13 | Exceptional 10.5% |
| Assyrians/Chaldeans/Syriacs | 100.0 /100 | #14 | Exceptional 10.6% |
| Immigrants | Armenia | 100.0 /100 | #15 | Exceptional 10.6% |