Houma vs Kenyan Median Female Earnings
COMPARE
Houma
Kenyan
Median Female Earnings
Median Female Earnings Comparison
Houma
Kenyans
$30,343
MEDIAN FEMALE EARNINGS
0.0/ 100
METRIC RATING
347th/ 347
METRIC RANK
$39,860
MEDIAN FEMALE EARNINGS
58.4/ 100
METRIC RATING
169th/ 347
METRIC RANK
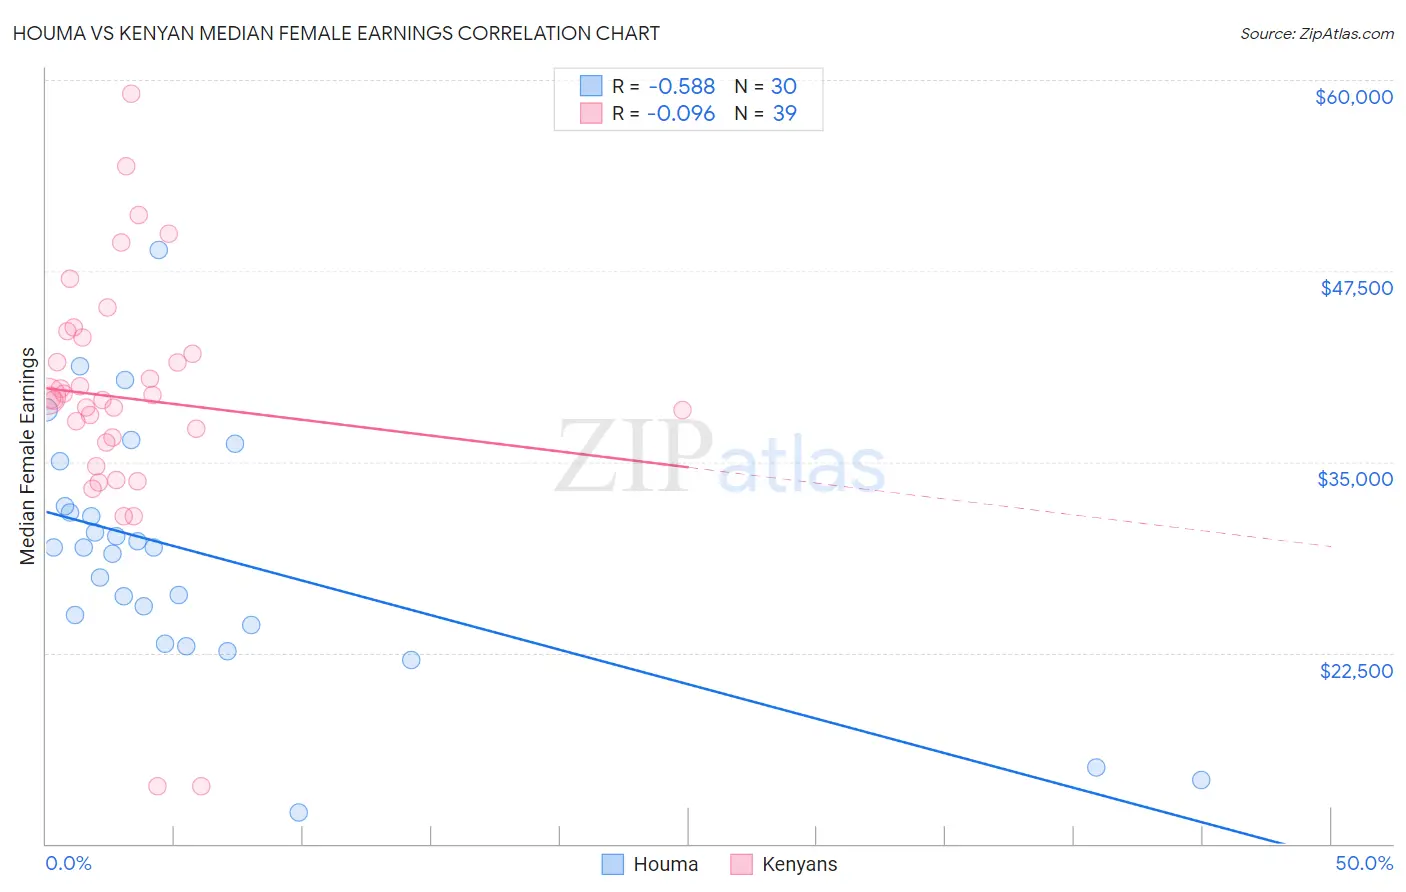
Houma vs Kenyan Median Female Earnings Correlation Chart
The statistical analysis conducted on geographies consisting of 36,795,297 people shows a substantial negative correlation between the proportion of Houma and median female earnings in the United States with a correlation coefficient (R) of -0.588 and weighted average of $30,343. Similarly, the statistical analysis conducted on geographies consisting of 168,237,877 people shows a slight negative correlation between the proportion of Kenyans and median female earnings in the United States with a correlation coefficient (R) of -0.096 and weighted average of $39,860, a difference of 31.4%.
Median Female Earnings Correlation Summary
| Measurement | Houma | Kenyan |
| Minimum | $12,038 | $13,750 |
| Maximum | $48,900 | $59,125 |
| Range | $36,862 | $45,375 |
| Mean | $28,868 | $39,183 |
| Median | $29,403 | $39,212 |
| Interquartile 25% (IQ1) | $24,292 | $36,279 |
| Interquartile 75% (IQ3) | $32,114 | $43,131 |
| Interquartile Range (IQR) | $7,822 | $6,851 |
| Standard Deviation (Sample) | $8,016 | $8,498 |
| Standard Deviation (Population) | $7,881 | $8,388 |
Similar Demographics by Median Female Earnings
Demographics Similar to Houma by Median Female Earnings
In terms of median female earnings, the demographic groups most similar to Houma are Arapaho ($31,489, a difference of 3.8%), Puerto Rican ($31,560, a difference of 4.0%), Lumbee ($32,500, a difference of 7.1%), Pueblo ($32,564, a difference of 7.3%), and Yup'ik ($32,730, a difference of 7.9%).
| Demographics | Rating | Rank | Median Female Earnings |
| Mexicans | 0.0 /100 | #333 | Tragic $33,664 |
| Spanish American Indians | 0.0 /100 | #334 | Tragic $33,625 |
| Creek | 0.0 /100 | #335 | Tragic $33,437 |
| Ottawa | 0.0 /100 | #336 | Tragic $33,378 |
| Yakama | 0.0 /100 | #337 | Tragic $33,354 |
| Immigrants | Cuba | 0.0 /100 | #338 | Tragic $33,291 |
| Immigrants | Mexico | 0.0 /100 | #339 | Tragic $33,236 |
| Tohono O'odham | 0.0 /100 | #340 | Tragic $33,205 |
| Navajo | 0.0 /100 | #341 | Tragic $33,046 |
| Yup'ik | 0.0 /100 | #342 | Tragic $32,730 |
| Pueblo | 0.0 /100 | #343 | Tragic $32,564 |
| Lumbee | 0.0 /100 | #344 | Tragic $32,500 |
| Puerto Ricans | 0.0 /100 | #345 | Tragic $31,560 |
| Arapaho | 0.0 /100 | #346 | Tragic $31,489 |
| Houma | 0.0 /100 | #347 | Tragic $30,343 |
Demographics Similar to Kenyans by Median Female Earnings
In terms of median female earnings, the demographic groups most similar to Kenyans are Immigrants from Peru ($39,871, a difference of 0.030%), Immigrants from Ghana ($39,894, a difference of 0.080%), Luxembourger ($39,891, a difference of 0.080%), Slovene ($39,817, a difference of 0.11%), and Immigrants from Bangladesh ($39,910, a difference of 0.12%).
| Demographics | Rating | Rank | Median Female Earnings |
| South American Indians | 66.1 /100 | #162 | Good $40,019 |
| Lebanese | 65.5 /100 | #163 | Good $40,006 |
| Immigrants | Saudi Arabia | 62.9 /100 | #164 | Good $39,952 |
| Immigrants | Bangladesh | 60.8 /100 | #165 | Good $39,910 |
| Immigrants | Ghana | 60.0 /100 | #166 | Good $39,894 |
| Luxembourgers | 59.9 /100 | #167 | Average $39,891 |
| Immigrants | Peru | 58.9 /100 | #168 | Average $39,871 |
| Kenyans | 58.4 /100 | #169 | Average $39,860 |
| Slovenes | 56.2 /100 | #170 | Average $39,817 |
| Immigrants | Portugal | 54.7 /100 | #171 | Average $39,788 |
| British | 53.8 /100 | #172 | Average $39,772 |
| Canadians | 51.4 /100 | #173 | Average $39,724 |
| South Americans | 50.0 /100 | #174 | Average $39,698 |
| Immigrants | South America | 47.2 /100 | #175 | Average $39,643 |
| Nigerians | 47.0 /100 | #176 | Average $39,641 |