Houma vs Immigrants from Hong Kong In Labor Force | Age 20-64
COMPARE
Houma
Immigrants from Hong Kong
In Labor Force | Age 20-64
In Labor Force | Age 20-64 Comparison
Houma
Immigrants from Hong Kong
72.7%
IN LABOR FORCE | AGE 20-64
0.0/ 100
METRIC RATING
339th/ 347
METRIC RANK
80.4%
IN LABOR FORCE | AGE 20-64
99.5/ 100
METRIC RATING
48th/ 347
METRIC RANK
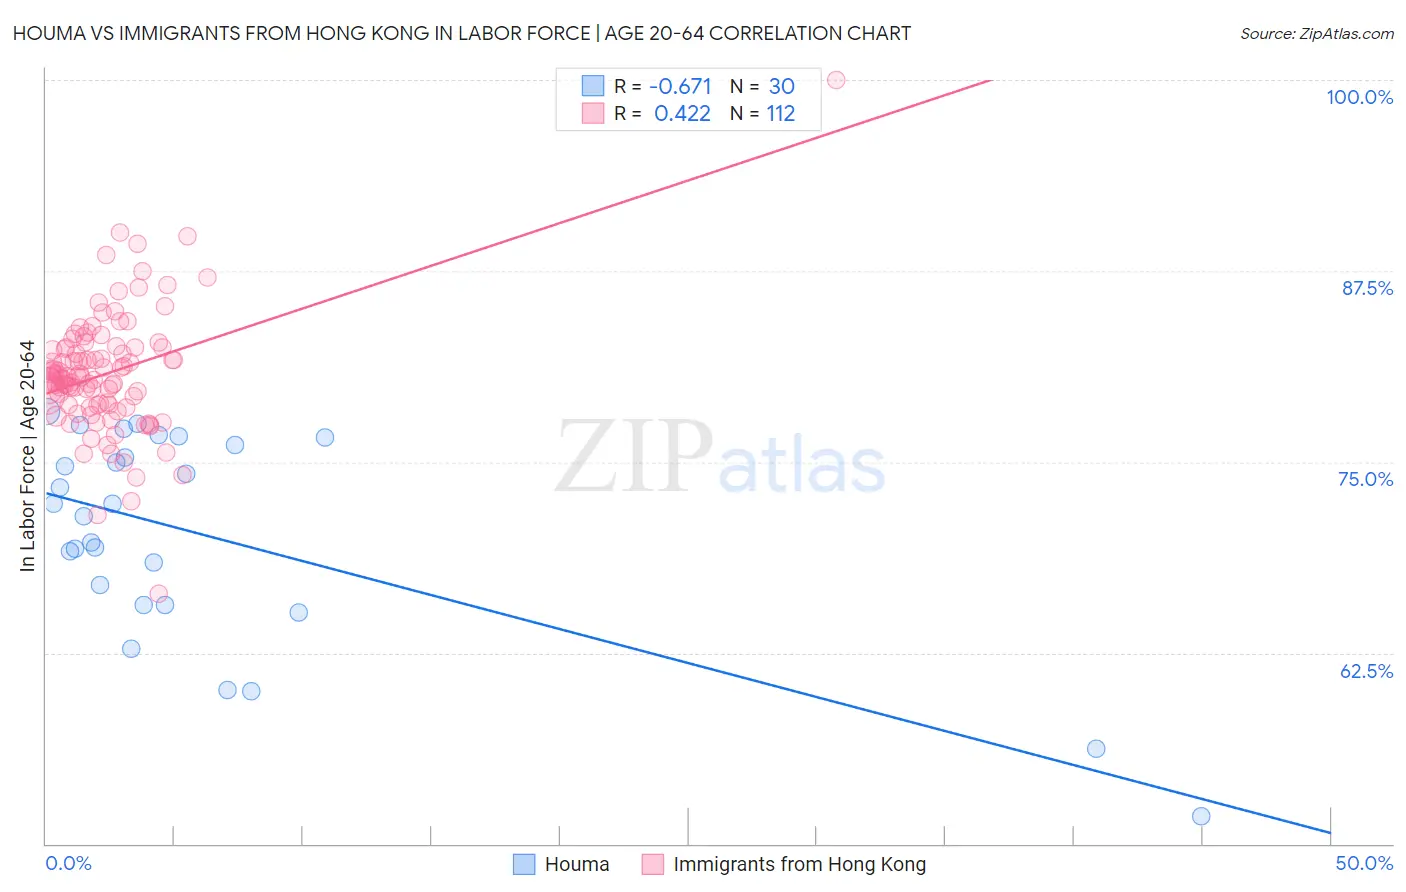
Houma vs Immigrants from Hong Kong In Labor Force | Age 20-64 Correlation Chart
The statistical analysis conducted on geographies consisting of 36,797,748 people shows a significant negative correlation between the proportion of Houma and labor force participation rate among population between the ages 20 and 64 in the United States with a correlation coefficient (R) of -0.671 and weighted average of 72.7%. Similarly, the statistical analysis conducted on geographies consisting of 254,003,180 people shows a moderate positive correlation between the proportion of Immigrants from Hong Kong and labor force participation rate among population between the ages 20 and 64 in the United States with a correlation coefficient (R) of 0.422 and weighted average of 80.4%, a difference of 10.5%.
In Labor Force | Age 20-64 Correlation Summary
| Measurement | Houma | Immigrants from Hong Kong |
| Minimum | 51.8% | 66.4% |
| Maximum | 78.3% | 100.0% |
| Range | 26.5% | 33.6% |
| Mean | 70.2% | 80.8% |
| Median | 71.9% | 80.6% |
| Interquartile 25% (IQ1) | 65.6% | 78.7% |
| Interquartile 75% (IQ3) | 76.1% | 82.5% |
| Interquartile Range (IQR) | 10.5% | 3.7% |
| Standard Deviation (Sample) | 6.9% | 4.1% |
| Standard Deviation (Population) | 6.7% | 4.0% |
Similar Demographics by In Labor Force | Age 20-64
Demographics Similar to Houma by In Labor Force | Age 20-64
In terms of in labor force | age 20-64, the demographic groups most similar to Houma are Pueblo (72.6%, a difference of 0.15%), Puerto Rican (73.1%, a difference of 0.43%), Yup'ik (73.2%, a difference of 0.64%), Immigrants from Yemen (72.3%, a difference of 0.64%), and Crow (73.3%, a difference of 0.76%).
| Demographics | Rating | Rank | In Labor Force | Age 20-64 |
| Arapaho | 0.0 /100 | #332 | Tragic 74.4% |
| Natives/Alaskans | 0.0 /100 | #333 | Tragic 73.9% |
| Apache | 0.0 /100 | #334 | Tragic 73.7% |
| Ute | 0.0 /100 | #335 | Tragic 73.7% |
| Crow | 0.0 /100 | #336 | Tragic 73.3% |
| Yup'ik | 0.0 /100 | #337 | Tragic 73.2% |
| Puerto Ricans | 0.0 /100 | #338 | Tragic 73.1% |
| Houma | 0.0 /100 | #339 | Tragic 72.7% |
| Pueblo | 0.0 /100 | #340 | Tragic 72.6% |
| Immigrants | Yemen | 0.0 /100 | #341 | Tragic 72.3% |
| Yuman | 0.0 /100 | #342 | Tragic 71.7% |
| Hopi | 0.0 /100 | #343 | Tragic 71.7% |
| Lumbee | 0.0 /100 | #344 | Tragic 70.6% |
| Tohono O'odham | 0.0 /100 | #345 | Tragic 70.4% |
| Navajo | 0.0 /100 | #346 | Tragic 69.2% |
Demographics Similar to Immigrants from Hong Kong by In Labor Force | Age 20-64
In terms of in labor force | age 20-64, the demographic groups most similar to Immigrants from Hong Kong are Immigrants from Africa (80.4%, a difference of 0.020%), Immigrants from Greece (80.4%, a difference of 0.040%), Immigrants from Sudan (80.4%, a difference of 0.050%), Slovene (80.5%, a difference of 0.060%), and Immigrants from Pakistan (80.5%, a difference of 0.060%).
| Demographics | Rating | Rank | In Labor Force | Age 20-64 |
| Immigrants | Liberia | 99.8 /100 | #41 | Exceptional 80.5% |
| Latvians | 99.8 /100 | #42 | Exceptional 80.5% |
| Czechs | 99.7 /100 | #43 | Exceptional 80.5% |
| Immigrants | Middle Africa | 99.7 /100 | #44 | Exceptional 80.5% |
| Slovenes | 99.7 /100 | #45 | Exceptional 80.5% |
| Immigrants | Pakistan | 99.6 /100 | #46 | Exceptional 80.5% |
| Immigrants | Africa | 99.6 /100 | #47 | Exceptional 80.4% |
| Immigrants | Hong Kong | 99.5 /100 | #48 | Exceptional 80.4% |
| Immigrants | Greece | 99.4 /100 | #49 | Exceptional 80.4% |
| Immigrants | Sudan | 99.4 /100 | #50 | Exceptional 80.4% |
| Immigrants | Sri Lanka | 99.3 /100 | #51 | Exceptional 80.4% |
| Turks | 99.2 /100 | #52 | Exceptional 80.3% |
| Immigrants | Peru | 99.2 /100 | #53 | Exceptional 80.3% |
| Peruvians | 99.1 /100 | #54 | Exceptional 80.3% |
| Immigrants | Cabo Verde | 99.0 /100 | #55 | Exceptional 80.3% |