Houma vs Immigrants from Hong Kong Single Male Poverty
COMPARE
Houma
Immigrants from Hong Kong
Single Male Poverty
Single Male Poverty Comparison
Houma
Immigrants from Hong Kong
23.5%
SINGLE MALE POVERTY
0.0/ 100
METRIC RATING
342nd/ 347
METRIC RANK
10.4%
SINGLE MALE POVERTY
100.0/ 100
METRIC RATING
4th/ 347
METRIC RANK
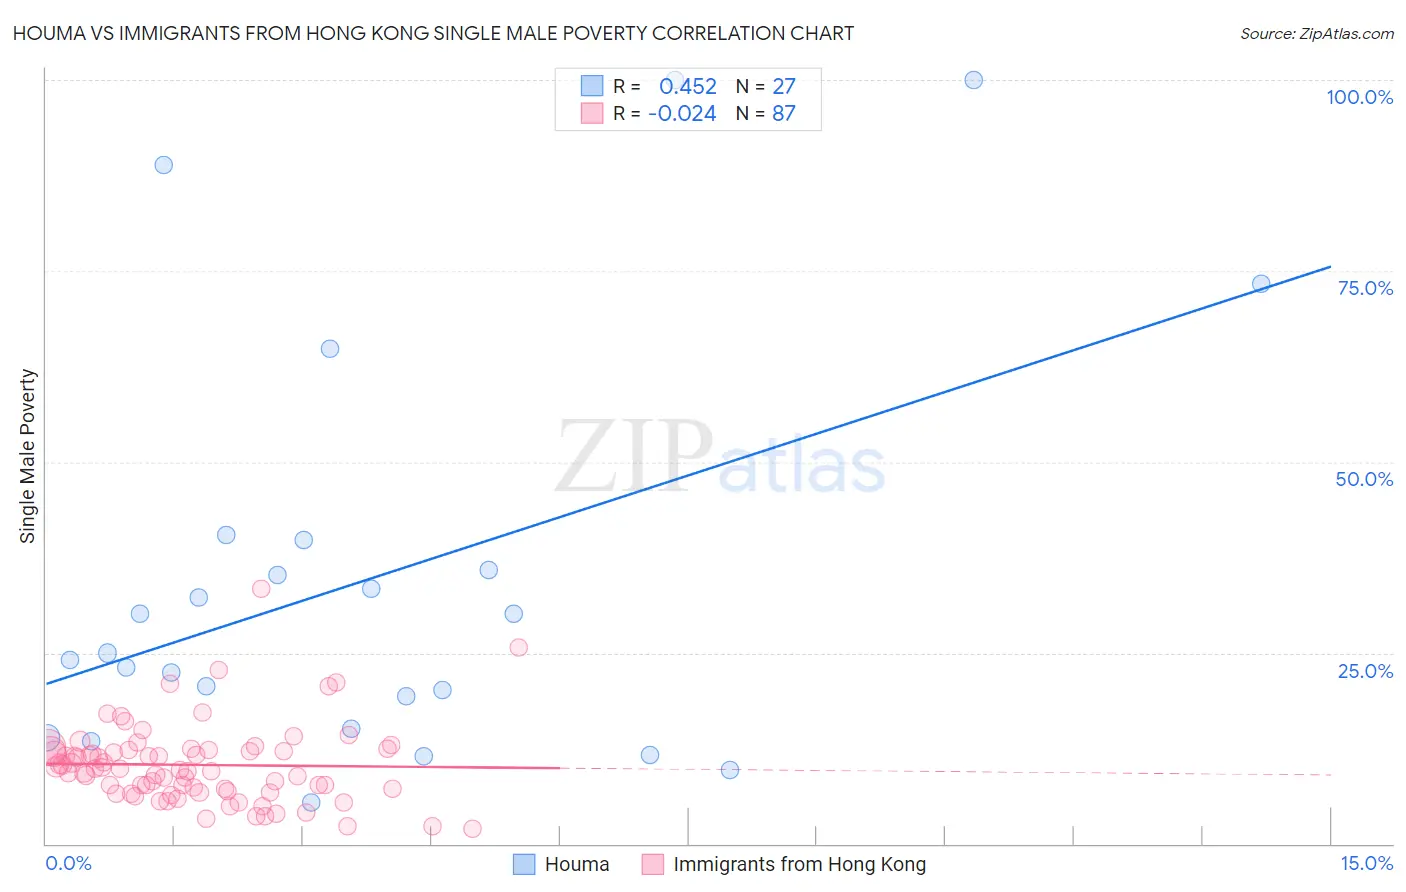
Houma vs Immigrants from Hong Kong Single Male Poverty Correlation Chart
The statistical analysis conducted on geographies consisting of 35,894,228 people shows a moderate positive correlation between the proportion of Houma and poverty level among single males in the United States with a correlation coefficient (R) of 0.452 and weighted average of 23.5%. Similarly, the statistical analysis conducted on geographies consisting of 230,546,344 people shows no correlation between the proportion of Immigrants from Hong Kong and poverty level among single males in the United States with a correlation coefficient (R) of -0.024 and weighted average of 10.4%, a difference of 124.5%.
Single Male Poverty Correlation Summary
| Measurement | Houma | Immigrants from Hong Kong |
| Minimum | 5.4% | 1.9% |
| Maximum | 100.0% | 33.3% |
| Range | 94.6% | 31.4% |
| Mean | 34.8% | 10.3% |
| Median | 25.0% | 9.8% |
| Interquartile 25% (IQ1) | 15.1% | 6.8% |
| Interquartile 75% (IQ3) | 39.7% | 12.3% |
| Interquartile Range (IQR) | 24.7% | 5.4% |
| Standard Deviation (Sample) | 27.0% | 5.2% |
| Standard Deviation (Population) | 26.5% | 5.2% |
Similar Demographics by Single Male Poverty
Demographics Similar to Houma by Single Male Poverty
In terms of single male poverty, the demographic groups most similar to Houma are Crow (23.3%, a difference of 0.82%), Sioux (22.2%, a difference of 5.6%), Arapaho (21.9%, a difference of 6.9%), Puerto Rican (25.1%, a difference of 6.9%), and Lumbee (25.2%, a difference of 7.3%).
| Demographics | Rating | Rank | Single Male Poverty |
| Inupiat | 0.0 /100 | #333 | Tragic 20.0% |
| Pima | 0.0 /100 | #334 | Tragic 20.2% |
| Yuman | 0.0 /100 | #335 | Tragic 21.3% |
| Tohono O'odham | 0.0 /100 | #336 | Tragic 21.6% |
| Apache | 0.0 /100 | #337 | Tragic 21.6% |
| Pueblo | 0.0 /100 | #338 | Tragic 21.6% |
| Arapaho | 0.0 /100 | #339 | Tragic 21.9% |
| Sioux | 0.0 /100 | #340 | Tragic 22.2% |
| Crow | 0.0 /100 | #341 | Tragic 23.3% |
| Houma | 0.0 /100 | #342 | Tragic 23.5% |
| Puerto Ricans | 0.0 /100 | #343 | Tragic 25.1% |
| Lumbee | 0.0 /100 | #344 | Tragic 25.2% |
| Navajo | 0.0 /100 | #345 | Tragic 25.3% |
| Hopi | 0.0 /100 | #346 | Tragic 27.5% |
| Yup'ik | 0.0 /100 | #347 | Tragic 31.6% |
Demographics Similar to Immigrants from Hong Kong by Single Male Poverty
In terms of single male poverty, the demographic groups most similar to Immigrants from Hong Kong are Tongan (10.5%, a difference of 0.060%), Immigrants from India (10.3%, a difference of 0.97%), Immigrants from Taiwan (10.3%, a difference of 1.7%), Filipino (10.6%, a difference of 1.7%), and Afghan (10.7%, a difference of 2.5%).
| Demographics | Rating | Rank | Single Male Poverty |
| Assyrians/Chaldeans/Syriacs | 100.0 /100 | #1 | Exceptional 9.8% |
| Immigrants | Taiwan | 100.0 /100 | #2 | Exceptional 10.3% |
| Immigrants | India | 100.0 /100 | #3 | Exceptional 10.3% |
| Immigrants | Hong Kong | 100.0 /100 | #4 | Exceptional 10.4% |
| Tongans | 100.0 /100 | #5 | Exceptional 10.5% |
| Filipinos | 100.0 /100 | #6 | Exceptional 10.6% |
| Afghans | 100.0 /100 | #7 | Exceptional 10.7% |
| Thais | 100.0 /100 | #8 | Exceptional 10.8% |
| Taiwanese | 100.0 /100 | #9 | Exceptional 10.9% |
| Immigrants | Fiji | 100.0 /100 | #10 | Exceptional 10.9% |
| Immigrants | Philippines | 100.0 /100 | #11 | Exceptional 10.9% |
| Immigrants | Afghanistan | 100.0 /100 | #12 | Exceptional 10.9% |
| Immigrants | South Central Asia | 100.0 /100 | #13 | Exceptional 10.9% |
| Chinese | 100.0 /100 | #14 | Exceptional 11.0% |
| Koreans | 100.0 /100 | #15 | Exceptional 11.0% |