Fijian vs Immigrants from Hong Kong Median Female Earnings
COMPARE
Fijian
Immigrants from Hong Kong
Median Female Earnings
Median Female Earnings Comparison
Fijians
Immigrants from Hong Kong
$35,114
MEDIAN FEMALE EARNINGS
0.0/ 100
METRIC RATING
306th/ 347
METRIC RANK
$49,818
MEDIAN FEMALE EARNINGS
100.0/ 100
METRIC RATING
1st/ 347
METRIC RANK
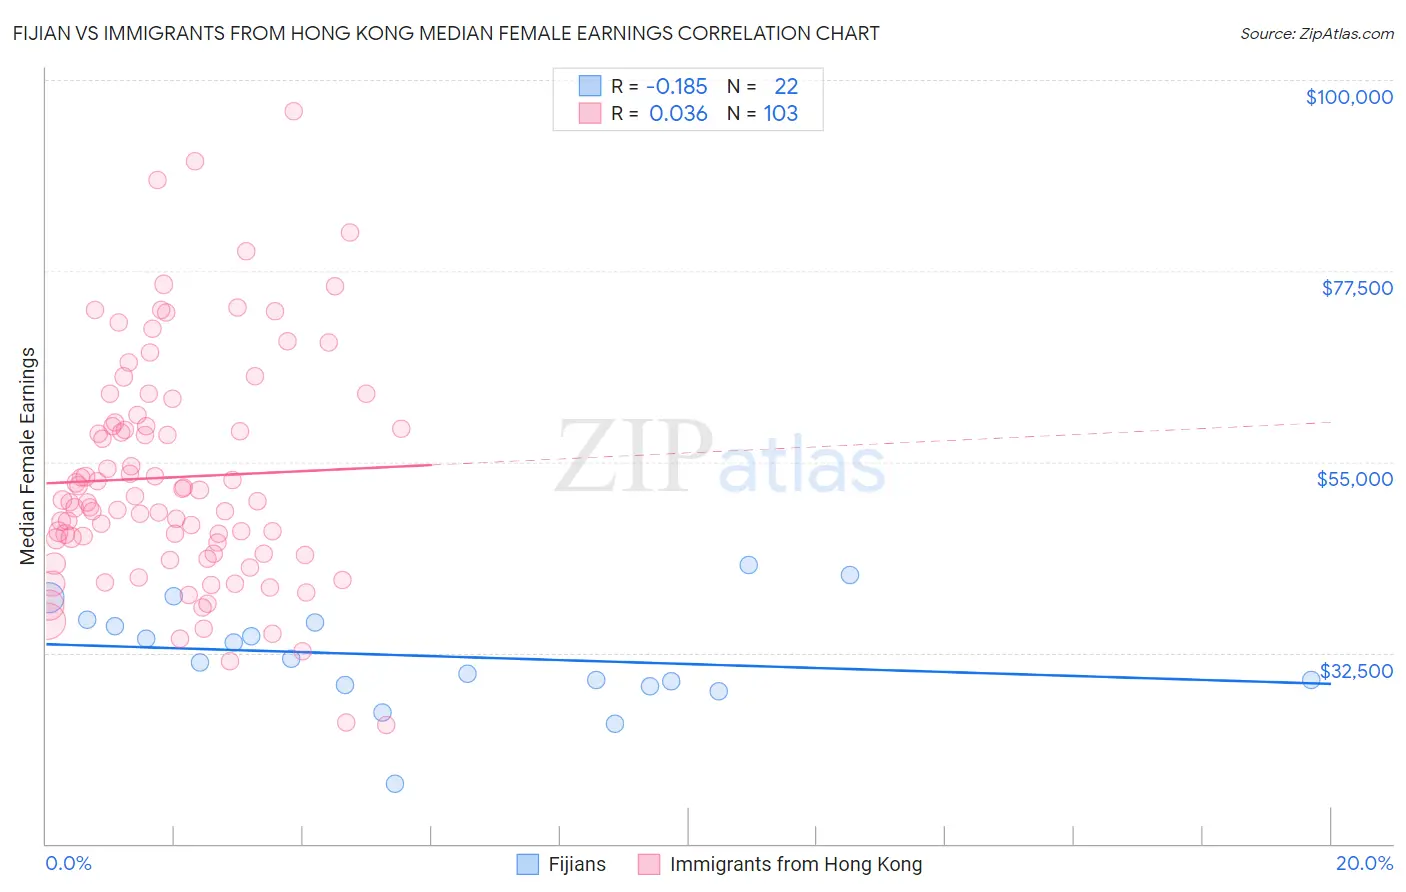
Fijian vs Immigrants from Hong Kong Median Female Earnings Correlation Chart
The statistical analysis conducted on geographies consisting of 55,944,407 people shows a poor negative correlation between the proportion of Fijians and median female earnings in the United States with a correlation coefficient (R) of -0.185 and weighted average of $35,114. Similarly, the statistical analysis conducted on geographies consisting of 253,932,744 people shows no correlation between the proportion of Immigrants from Hong Kong and median female earnings in the United States with a correlation coefficient (R) of 0.036 and weighted average of $49,818, a difference of 41.9%.
Median Female Earnings Correlation Summary
| Measurement | Fijian | Immigrants from Hong Kong |
| Minimum | $17,125 | $24,038 |
| Maximum | $42,895 | $96,250 |
| Range | $25,770 | $72,212 |
| Mean | $32,097 | $53,195 |
| Median | $31,625 | $50,354 |
| Interquartile 25% (IQ1) | $28,766 | $44,209 |
| Interquartile 75% (IQ3) | $36,076 | $59,618 |
| Interquartile Range (IQR) | $7,310 | $15,409 |
| Standard Deviation (Sample) | $6,055 | $13,646 |
| Standard Deviation (Population) | $5,916 | $13,580 |
Similar Demographics by Median Female Earnings
Demographics Similar to Fijians by Median Female Earnings
In terms of median female earnings, the demographic groups most similar to Fijians are Bahamian ($35,125, a difference of 0.030%), Sioux ($35,063, a difference of 0.15%), Immigrants from Bahamas ($35,027, a difference of 0.25%), Honduran ($35,013, a difference of 0.29%), and Chippewa ($35,003, a difference of 0.32%).
| Demographics | Rating | Rank | Median Female Earnings |
| Immigrants | Guatemala | 0.0 /100 | #299 | Tragic $35,444 |
| Yuman | 0.0 /100 | #300 | Tragic $35,377 |
| Pima | 0.0 /100 | #301 | Tragic $35,326 |
| Blacks/African Americans | 0.0 /100 | #302 | Tragic $35,315 |
| Immigrants | Latin America | 0.0 /100 | #303 | Tragic $35,307 |
| Crow | 0.0 /100 | #304 | Tragic $35,266 |
| Bahamians | 0.0 /100 | #305 | Tragic $35,125 |
| Fijians | 0.0 /100 | #306 | Tragic $35,114 |
| Sioux | 0.0 /100 | #307 | Tragic $35,063 |
| Immigrants | Bahamas | 0.0 /100 | #308 | Tragic $35,027 |
| Hondurans | 0.0 /100 | #309 | Tragic $35,013 |
| Chippewa | 0.0 /100 | #310 | Tragic $35,003 |
| Ute | 0.0 /100 | #311 | Tragic $34,960 |
| Yaqui | 0.0 /100 | #312 | Tragic $34,943 |
| Cubans | 0.0 /100 | #313 | Tragic $34,942 |
Demographics Similar to Immigrants from Hong Kong by Median Female Earnings
In terms of median female earnings, the demographic groups most similar to Immigrants from Hong Kong are Filipino ($49,508, a difference of 0.63%), Immigrants from Taiwan ($49,256, a difference of 1.1%), Immigrants from India ($48,292, a difference of 3.2%), Immigrants from Singapore ($47,986, a difference of 3.8%), and Immigrants from Ireland ($47,598, a difference of 4.7%).
| Demographics | Rating | Rank | Median Female Earnings |
| Immigrants | Hong Kong | 100.0 /100 | #1 | Exceptional $49,818 |
| Filipinos | 100.0 /100 | #2 | Exceptional $49,508 |
| Immigrants | Taiwan | 100.0 /100 | #3 | Exceptional $49,256 |
| Immigrants | India | 100.0 /100 | #4 | Exceptional $48,292 |
| Immigrants | Singapore | 100.0 /100 | #5 | Exceptional $47,986 |
| Immigrants | Ireland | 100.0 /100 | #6 | Exceptional $47,598 |
| Thais | 100.0 /100 | #7 | Exceptional $47,577 |
| Iranians | 100.0 /100 | #8 | Exceptional $47,421 |
| Immigrants | Iran | 100.0 /100 | #9 | Exceptional $47,154 |
| Immigrants | China | 100.0 /100 | #10 | Exceptional $46,972 |
| Okinawans | 100.0 /100 | #11 | Exceptional $46,905 |
| Immigrants | Israel | 100.0 /100 | #12 | Exceptional $46,902 |
| Immigrants | Australia | 100.0 /100 | #13 | Exceptional $46,573 |
| Soviet Union | 100.0 /100 | #14 | Exceptional $46,556 |
| Immigrants | Eastern Asia | 100.0 /100 | #15 | Exceptional $46,502 |