Houma vs Immigrants from Brazil Median Female Earnings
COMPARE
Houma
Immigrants from Brazil
Median Female Earnings
Median Female Earnings Comparison
Houma
Immigrants from Brazil
$30,343
MEDIAN FEMALE EARNINGS
0.0/ 100
METRIC RATING
347th/ 347
METRIC RANK
$41,273
MEDIAN FEMALE EARNINGS
96.4/ 100
METRIC RATING
116th/ 347
METRIC RANK
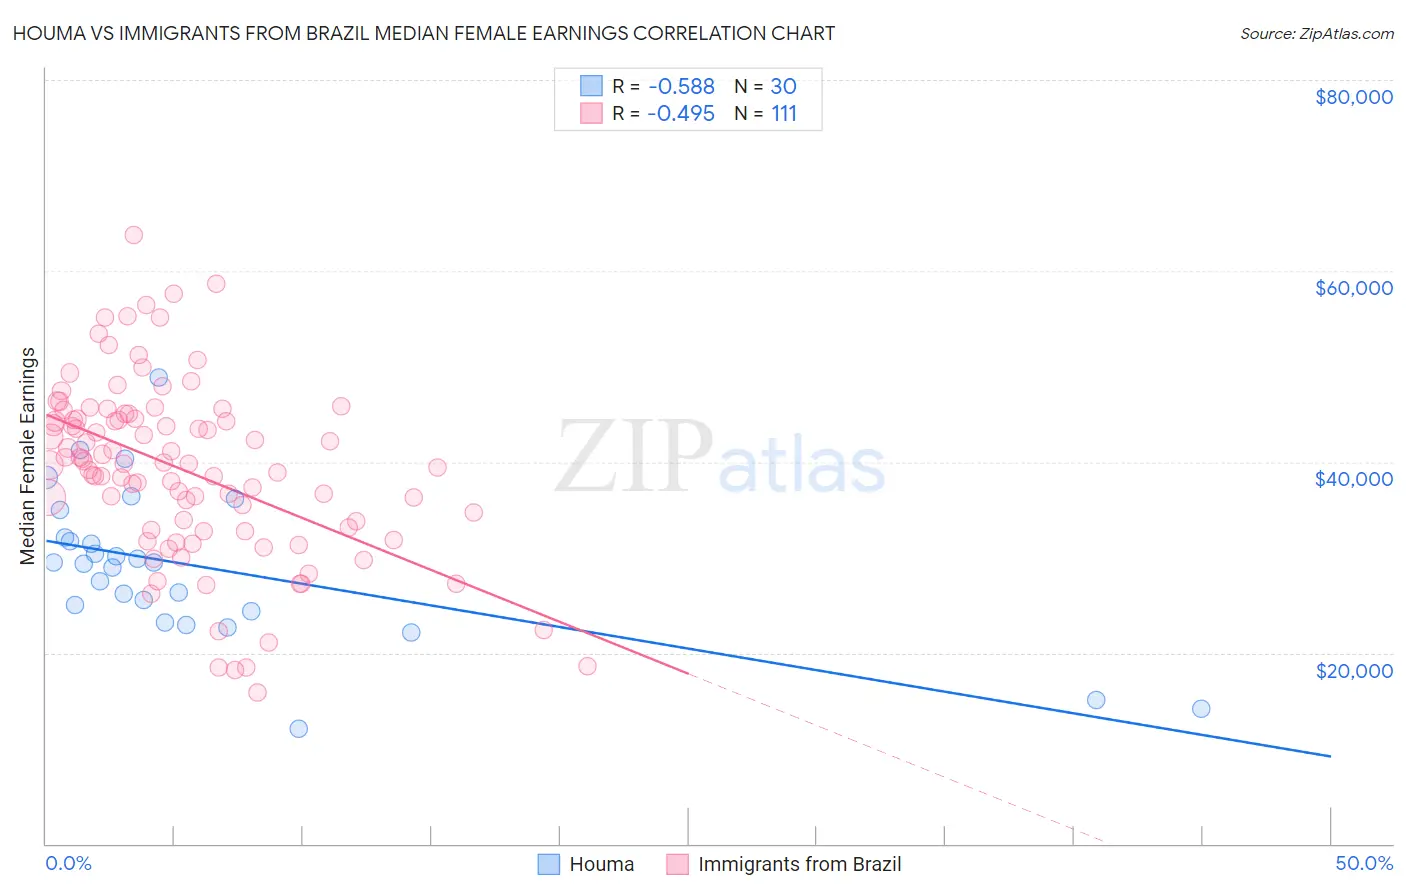
Houma vs Immigrants from Brazil Median Female Earnings Correlation Chart
The statistical analysis conducted on geographies consisting of 36,795,297 people shows a substantial negative correlation between the proportion of Houma and median female earnings in the United States with a correlation coefficient (R) of -0.588 and weighted average of $30,343. Similarly, the statistical analysis conducted on geographies consisting of 342,933,963 people shows a moderate negative correlation between the proportion of Immigrants from Brazil and median female earnings in the United States with a correlation coefficient (R) of -0.495 and weighted average of $41,273, a difference of 36.0%.
Median Female Earnings Correlation Summary
| Measurement | Houma | Immigrants from Brazil |
| Minimum | $12,038 | $15,833 |
| Maximum | $48,900 | $63,747 |
| Range | $36,862 | $47,914 |
| Mean | $28,868 | $39,161 |
| Median | $29,403 | $39,865 |
| Interquartile 25% (IQ1) | $24,292 | $32,810 |
| Interquartile 75% (IQ3) | $32,114 | $44,568 |
| Interquartile Range (IQR) | $7,822 | $11,758 |
| Standard Deviation (Sample) | $8,016 | $9,325 |
| Standard Deviation (Population) | $7,881 | $9,283 |
Similar Demographics by Median Female Earnings
Demographics Similar to Houma by Median Female Earnings
In terms of median female earnings, the demographic groups most similar to Houma are Arapaho ($31,489, a difference of 3.8%), Puerto Rican ($31,560, a difference of 4.0%), Lumbee ($32,500, a difference of 7.1%), Pueblo ($32,564, a difference of 7.3%), and Yup'ik ($32,730, a difference of 7.9%).
| Demographics | Rating | Rank | Median Female Earnings |
| Mexicans | 0.0 /100 | #333 | Tragic $33,664 |
| Spanish American Indians | 0.0 /100 | #334 | Tragic $33,625 |
| Creek | 0.0 /100 | #335 | Tragic $33,437 |
| Ottawa | 0.0 /100 | #336 | Tragic $33,378 |
| Yakama | 0.0 /100 | #337 | Tragic $33,354 |
| Immigrants | Cuba | 0.0 /100 | #338 | Tragic $33,291 |
| Immigrants | Mexico | 0.0 /100 | #339 | Tragic $33,236 |
| Tohono O'odham | 0.0 /100 | #340 | Tragic $33,205 |
| Navajo | 0.0 /100 | #341 | Tragic $33,046 |
| Yup'ik | 0.0 /100 | #342 | Tragic $32,730 |
| Pueblo | 0.0 /100 | #343 | Tragic $32,564 |
| Lumbee | 0.0 /100 | #344 | Tragic $32,500 |
| Puerto Ricans | 0.0 /100 | #345 | Tragic $31,560 |
| Arapaho | 0.0 /100 | #346 | Tragic $31,489 |
| Houma | 0.0 /100 | #347 | Tragic $30,343 |
Demographics Similar to Immigrants from Brazil by Median Female Earnings
In terms of median female earnings, the demographic groups most similar to Immigrants from Brazil are Immigrants from England ($41,277, a difference of 0.010%), Korean ($41,276, a difference of 0.010%), Macedonian ($41,286, a difference of 0.030%), Barbadian ($41,261, a difference of 0.030%), and Immigrants from North America ($41,319, a difference of 0.11%).
| Demographics | Rating | Rank | Median Female Earnings |
| Chinese | 97.5 /100 | #109 | Exceptional $41,461 |
| Immigrants | Western Asia | 97.0 /100 | #110 | Exceptional $41,375 |
| Immigrants | Canada | 97.0 /100 | #111 | Exceptional $41,373 |
| Immigrants | North America | 96.7 /100 | #112 | Exceptional $41,319 |
| Macedonians | 96.4 /100 | #113 | Exceptional $41,286 |
| Immigrants | England | 96.4 /100 | #114 | Exceptional $41,277 |
| Koreans | 96.4 /100 | #115 | Exceptional $41,276 |
| Immigrants | Brazil | 96.4 /100 | #116 | Exceptional $41,273 |
| Barbadians | 96.3 /100 | #117 | Exceptional $41,261 |
| Immigrants | Lebanon | 95.6 /100 | #118 | Exceptional $41,183 |
| Immigrants | Philippines | 95.0 /100 | #119 | Exceptional $41,114 |
| Immigrants | Kuwait | 94.4 /100 | #120 | Exceptional $41,055 |
| Croatians | 93.7 /100 | #121 | Exceptional $40,993 |
| Immigrants | Jordan | 93.5 /100 | #122 | Exceptional $40,977 |
| Guyanese | 93.4 /100 | #123 | Exceptional $40,973 |