Houma vs Jamaican Median Female Earnings
COMPARE
Houma
Jamaican
Median Female Earnings
Median Female Earnings Comparison
Houma
Jamaicans
$30,343
MEDIAN FEMALE EARNINGS
0.0/ 100
METRIC RATING
347th/ 347
METRIC RANK
$38,670
MEDIAN FEMALE EARNINGS
10.5/ 100
METRIC RATING
213th/ 347
METRIC RANK
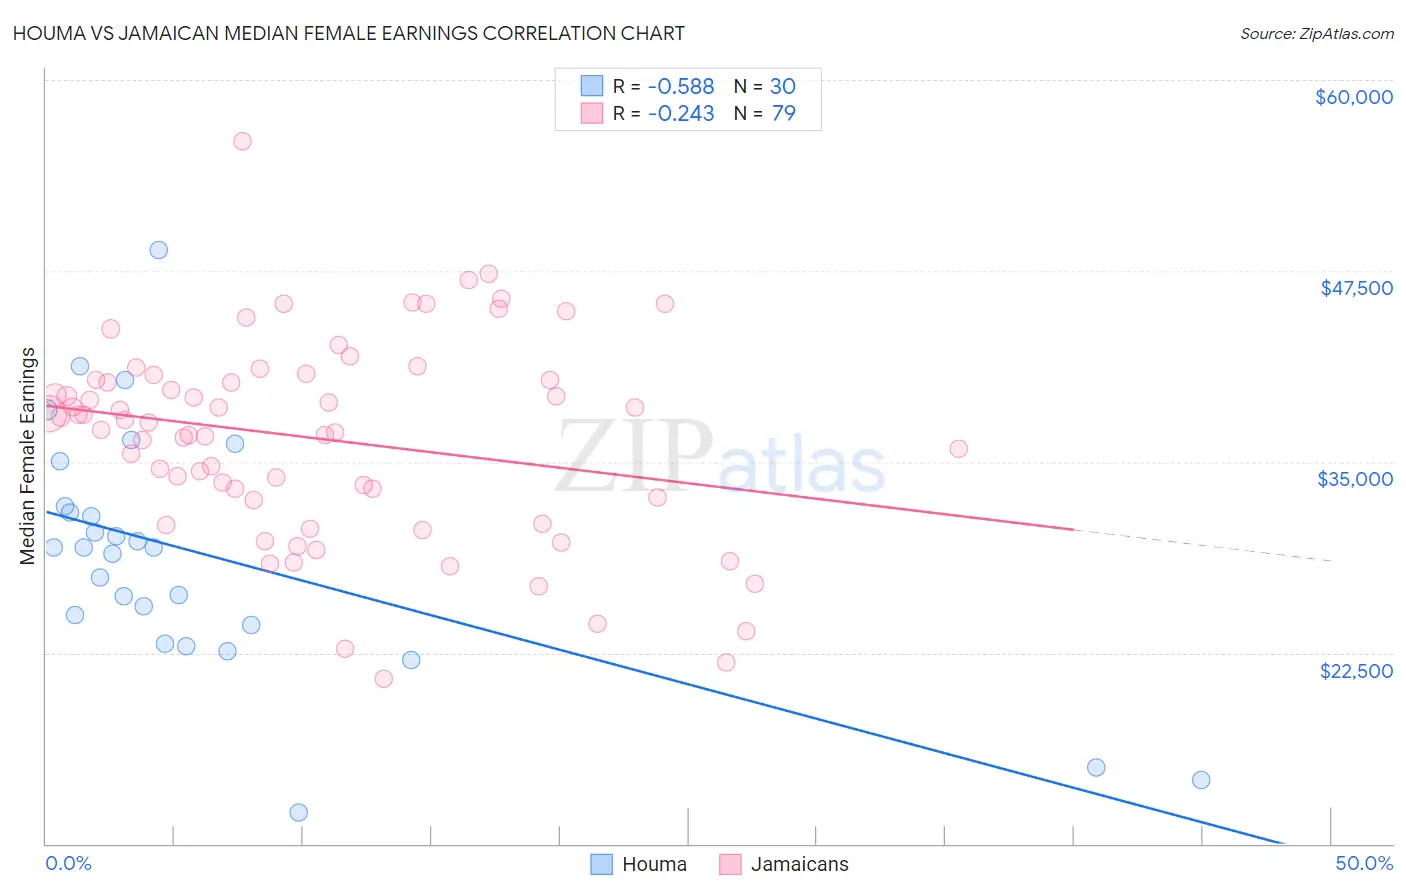
Houma vs Jamaican Median Female Earnings Correlation Chart
The statistical analysis conducted on geographies consisting of 36,795,297 people shows a substantial negative correlation between the proportion of Houma and median female earnings in the United States with a correlation coefficient (R) of -0.588 and weighted average of $30,343. Similarly, the statistical analysis conducted on geographies consisting of 367,929,945 people shows a weak negative correlation between the proportion of Jamaicans and median female earnings in the United States with a correlation coefficient (R) of -0.243 and weighted average of $38,670, a difference of 27.4%.
Median Female Earnings Correlation Summary
| Measurement | Houma | Jamaican |
| Minimum | $12,038 | $20,833 |
| Maximum | $48,900 | $56,012 |
| Range | $36,862 | $35,179 |
| Mean | $28,868 | $36,507 |
| Median | $29,403 | $37,552 |
| Interquartile 25% (IQ1) | $24,292 | $32,539 |
| Interquartile 75% (IQ3) | $32,114 | $40,387 |
| Interquartile Range (IQR) | $7,822 | $7,848 |
| Standard Deviation (Sample) | $8,016 | $6,597 |
| Standard Deviation (Population) | $7,881 | $6,555 |
Similar Demographics by Median Female Earnings
Demographics Similar to Houma by Median Female Earnings
In terms of median female earnings, the demographic groups most similar to Houma are Arapaho ($31,489, a difference of 3.8%), Puerto Rican ($31,560, a difference of 4.0%), Lumbee ($32,500, a difference of 7.1%), Pueblo ($32,564, a difference of 7.3%), and Yup'ik ($32,730, a difference of 7.9%).
| Demographics | Rating | Rank | Median Female Earnings |
| Mexicans | 0.0 /100 | #333 | Tragic $33,664 |
| Spanish American Indians | 0.0 /100 | #334 | Tragic $33,625 |
| Creek | 0.0 /100 | #335 | Tragic $33,437 |
| Ottawa | 0.0 /100 | #336 | Tragic $33,378 |
| Yakama | 0.0 /100 | #337 | Tragic $33,354 |
| Immigrants | Cuba | 0.0 /100 | #338 | Tragic $33,291 |
| Immigrants | Mexico | 0.0 /100 | #339 | Tragic $33,236 |
| Tohono O'odham | 0.0 /100 | #340 | Tragic $33,205 |
| Navajo | 0.0 /100 | #341 | Tragic $33,046 |
| Yup'ik | 0.0 /100 | #342 | Tragic $32,730 |
| Pueblo | 0.0 /100 | #343 | Tragic $32,564 |
| Lumbee | 0.0 /100 | #344 | Tragic $32,500 |
| Puerto Ricans | 0.0 /100 | #345 | Tragic $31,560 |
| Arapaho | 0.0 /100 | #346 | Tragic $31,489 |
| Houma | 0.0 /100 | #347 | Tragic $30,343 |
Demographics Similar to Jamaicans by Median Female Earnings
In terms of median female earnings, the demographic groups most similar to Jamaicans are Iraqi ($38,666, a difference of 0.010%), Spaniard ($38,656, a difference of 0.030%), Immigrants from Ecuador ($38,644, a difference of 0.070%), Guamanian/Chamorro ($38,717, a difference of 0.12%), and Immigrants from Jamaica ($38,625, a difference of 0.12%).
| Demographics | Rating | Rank | Median Female Earnings |
| Immigrants | Bosnia and Herzegovina | 15.6 /100 | #206 | Poor $38,886 |
| Immigrants | Cambodia | 14.2 /100 | #207 | Poor $38,833 |
| Immigrants | Thailand | 13.6 /100 | #208 | Poor $38,810 |
| Norwegians | 13.4 /100 | #209 | Poor $38,802 |
| Czechoslovakians | 12.0 /100 | #210 | Poor $38,738 |
| Aleuts | 11.6 /100 | #211 | Poor $38,719 |
| Guamanians/Chamorros | 11.5 /100 | #212 | Poor $38,717 |
| Jamaicans | 10.5 /100 | #213 | Poor $38,670 |
| Iraqis | 10.5 /100 | #214 | Poor $38,666 |
| Spaniards | 10.3 /100 | #215 | Poor $38,656 |
| Immigrants | Ecuador | 10.1 /100 | #216 | Poor $38,644 |
| Immigrants | Jamaica | 9.7 /100 | #217 | Tragic $38,625 |
| Cape Verdeans | 9.5 /100 | #218 | Tragic $38,614 |
| Nepalese | 9.3 /100 | #219 | Tragic $38,603 |
| Yugoslavians | 8.8 /100 | #220 | Tragic $38,573 |