Houma vs Immigrants from Greece Median Female Earnings
COMPARE
Houma
Immigrants from Greece
Median Female Earnings
Median Female Earnings Comparison
Houma
Immigrants from Greece
$30,343
MEDIAN FEMALE EARNINGS
0.0/ 100
METRIC RATING
347th/ 347
METRIC RANK
$44,976
MEDIAN FEMALE EARNINGS
100.0/ 100
METRIC RATING
22nd/ 347
METRIC RANK
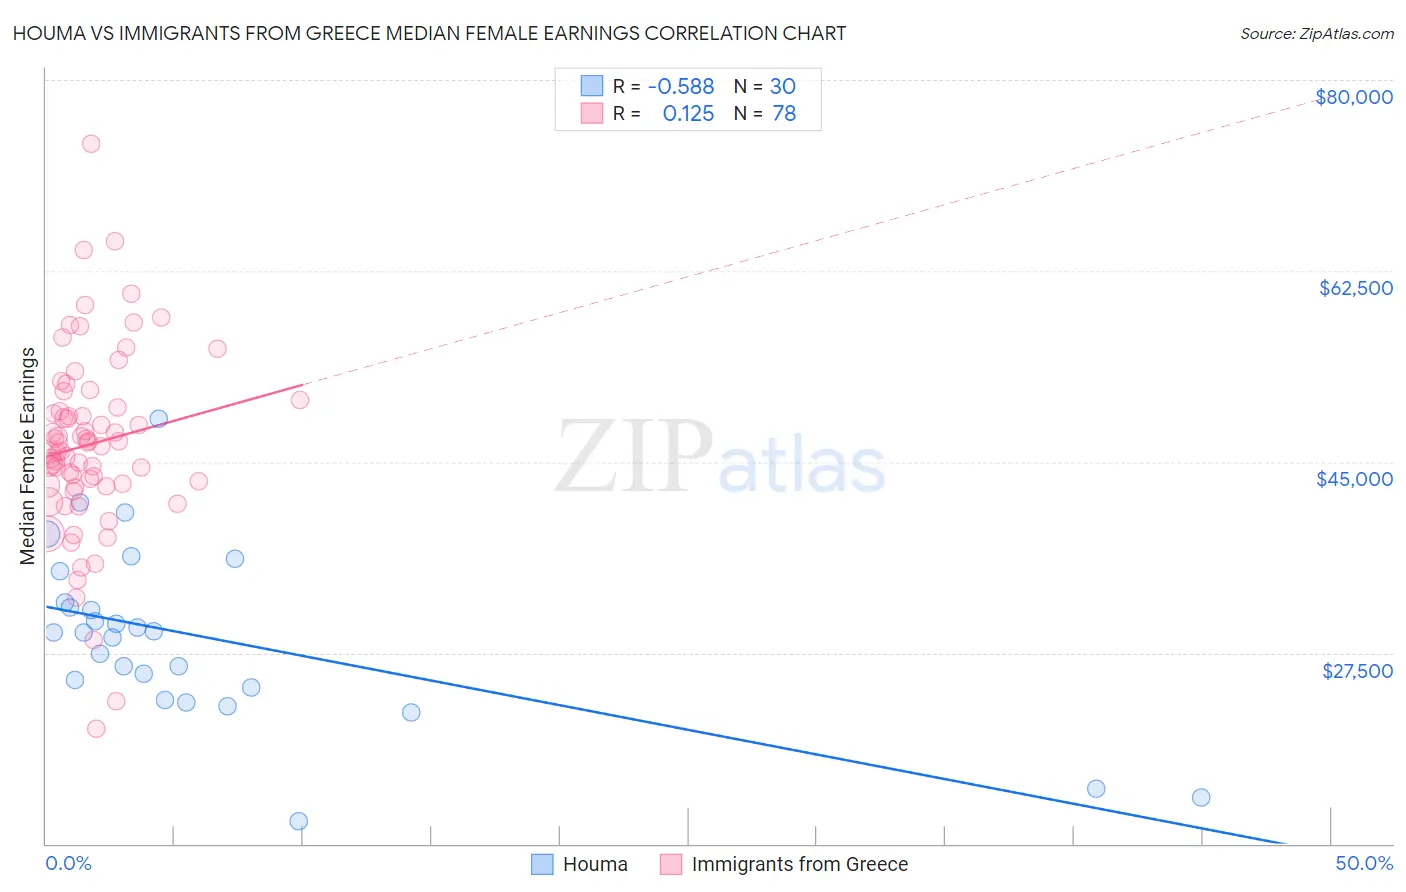
Houma vs Immigrants from Greece Median Female Earnings Correlation Chart
The statistical analysis conducted on geographies consisting of 36,795,297 people shows a substantial negative correlation between the proportion of Houma and median female earnings in the United States with a correlation coefficient (R) of -0.588 and weighted average of $30,343. Similarly, the statistical analysis conducted on geographies consisting of 216,834,744 people shows a poor positive correlation between the proportion of Immigrants from Greece and median female earnings in the United States with a correlation coefficient (R) of 0.125 and weighted average of $44,976, a difference of 48.2%.
Median Female Earnings Correlation Summary
| Measurement | Houma | Immigrants from Greece |
| Minimum | $12,038 | $20,568 |
| Maximum | $48,900 | $74,175 |
| Range | $36,862 | $53,607 |
| Mean | $28,868 | $46,608 |
| Median | $29,403 | $46,610 |
| Interquartile 25% (IQ1) | $24,292 | $42,848 |
| Interquartile 75% (IQ3) | $32,114 | $50,040 |
| Interquartile Range (IQR) | $7,822 | $7,192 |
| Standard Deviation (Sample) | $8,016 | $8,519 |
| Standard Deviation (Population) | $7,881 | $8,464 |
Similar Demographics by Median Female Earnings
Demographics Similar to Houma by Median Female Earnings
In terms of median female earnings, the demographic groups most similar to Houma are Arapaho ($31,489, a difference of 3.8%), Puerto Rican ($31,560, a difference of 4.0%), Lumbee ($32,500, a difference of 7.1%), Pueblo ($32,564, a difference of 7.3%), and Yup'ik ($32,730, a difference of 7.9%).
| Demographics | Rating | Rank | Median Female Earnings |
| Mexicans | 0.0 /100 | #333 | Tragic $33,664 |
| Spanish American Indians | 0.0 /100 | #334 | Tragic $33,625 |
| Creek | 0.0 /100 | #335 | Tragic $33,437 |
| Ottawa | 0.0 /100 | #336 | Tragic $33,378 |
| Yakama | 0.0 /100 | #337 | Tragic $33,354 |
| Immigrants | Cuba | 0.0 /100 | #338 | Tragic $33,291 |
| Immigrants | Mexico | 0.0 /100 | #339 | Tragic $33,236 |
| Tohono O'odham | 0.0 /100 | #340 | Tragic $33,205 |
| Navajo | 0.0 /100 | #341 | Tragic $33,046 |
| Yup'ik | 0.0 /100 | #342 | Tragic $32,730 |
| Pueblo | 0.0 /100 | #343 | Tragic $32,564 |
| Lumbee | 0.0 /100 | #344 | Tragic $32,500 |
| Puerto Ricans | 0.0 /100 | #345 | Tragic $31,560 |
| Arapaho | 0.0 /100 | #346 | Tragic $31,489 |
| Houma | 0.0 /100 | #347 | Tragic $30,343 |
Demographics Similar to Immigrants from Greece by Median Female Earnings
In terms of median female earnings, the demographic groups most similar to Immigrants from Greece are Cambodian ($45,014, a difference of 0.080%), Burmese ($44,911, a difference of 0.14%), Immigrants from Korea ($44,847, a difference of 0.29%), Immigrants from Sweden ($44,774, a difference of 0.45%), and Immigrants from Belarus ($44,757, a difference of 0.49%).
| Demographics | Rating | Rank | Median Female Earnings |
| Immigrants | Eastern Asia | 100.0 /100 | #15 | Exceptional $46,502 |
| Indians (Asian) | 100.0 /100 | #16 | Exceptional $46,481 |
| Immigrants | South Central Asia | 100.0 /100 | #17 | Exceptional $46,324 |
| Cypriots | 100.0 /100 | #18 | Exceptional $45,570 |
| Eastern Europeans | 100.0 /100 | #19 | Exceptional $45,385 |
| Immigrants | Japan | 100.0 /100 | #20 | Exceptional $45,323 |
| Cambodians | 100.0 /100 | #21 | Exceptional $45,014 |
| Immigrants | Greece | 100.0 /100 | #22 | Exceptional $44,976 |
| Burmese | 100.0 /100 | #23 | Exceptional $44,911 |
| Immigrants | Korea | 100.0 /100 | #24 | Exceptional $44,847 |
| Immigrants | Sweden | 100.0 /100 | #25 | Exceptional $44,774 |
| Immigrants | Belarus | 100.0 /100 | #26 | Exceptional $44,757 |
| Turks | 100.0 /100 | #27 | Exceptional $44,695 |
| Immigrants | Russia | 100.0 /100 | #28 | Exceptional $44,680 |
| Immigrants | Belgium | 100.0 /100 | #29 | Exceptional $44,587 |