Cambodian vs Immigrants from Hong Kong Median Female Earnings
COMPARE
Cambodian
Immigrants from Hong Kong
Median Female Earnings
Median Female Earnings Comparison
Cambodians
Immigrants from Hong Kong
$45,014
MEDIAN FEMALE EARNINGS
100.0/ 100
METRIC RATING
21st/ 347
METRIC RANK
$49,818
MEDIAN FEMALE EARNINGS
100.0/ 100
METRIC RATING
1st/ 347
METRIC RANK
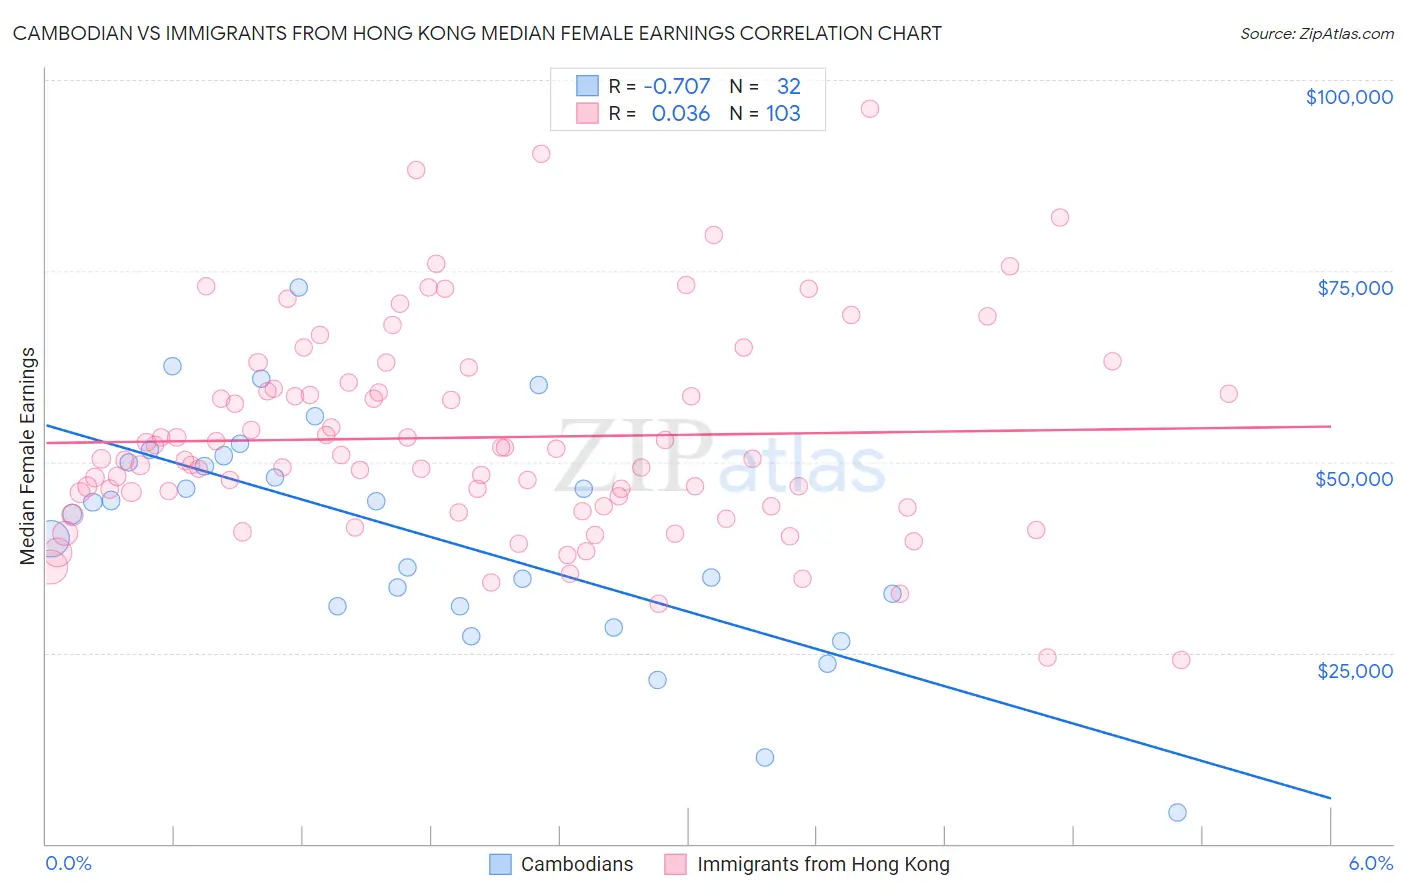
Cambodian vs Immigrants from Hong Kong Median Female Earnings Correlation Chart
The statistical analysis conducted on geographies consisting of 102,513,966 people shows a strong negative correlation between the proportion of Cambodians and median female earnings in the United States with a correlation coefficient (R) of -0.707 and weighted average of $45,014. Similarly, the statistical analysis conducted on geographies consisting of 253,932,744 people shows no correlation between the proportion of Immigrants from Hong Kong and median female earnings in the United States with a correlation coefficient (R) of 0.036 and weighted average of $49,818, a difference of 10.7%.
Median Female Earnings Correlation Summary
| Measurement | Cambodian | Immigrants from Hong Kong |
| Minimum | $4,132 | $24,038 |
| Maximum | $72,888 | $96,250 |
| Range | $68,756 | $72,212 |
| Mean | $40,669 | $53,195 |
| Median | $43,973 | $50,354 |
| Interquartile 25% (IQ1) | $31,093 | $44,209 |
| Interquartile 75% (IQ3) | $50,357 | $59,618 |
| Interquartile Range (IQR) | $19,265 | $15,409 |
| Standard Deviation (Sample) | $15,041 | $13,646 |
| Standard Deviation (Population) | $14,804 | $13,580 |
Demographics Similar to Cambodians and Immigrants from Hong Kong by Median Female Earnings
In terms of median female earnings, the demographic groups most similar to Cambodians are Immigrants from Japan ($45,323, a difference of 0.69%), Eastern European ($45,385, a difference of 0.82%), Cypriot ($45,570, a difference of 1.2%), Immigrants from South Central Asia ($46,324, a difference of 2.9%), and Indian (Asian) ($46,481, a difference of 3.3%). Similarly, the demographic groups most similar to Immigrants from Hong Kong are Filipino ($49,508, a difference of 0.63%), Immigrants from Taiwan ($49,256, a difference of 1.1%), Immigrants from India ($48,292, a difference of 3.2%), Immigrants from Singapore ($47,986, a difference of 3.8%), and Immigrants from Ireland ($47,598, a difference of 4.7%).
| Demographics | Rating | Rank | Median Female Earnings |
| Immigrants | Hong Kong | 100.0 /100 | #1 | Exceptional $49,818 |
| Filipinos | 100.0 /100 | #2 | Exceptional $49,508 |
| Immigrants | Taiwan | 100.0 /100 | #3 | Exceptional $49,256 |
| Immigrants | India | 100.0 /100 | #4 | Exceptional $48,292 |
| Immigrants | Singapore | 100.0 /100 | #5 | Exceptional $47,986 |
| Immigrants | Ireland | 100.0 /100 | #6 | Exceptional $47,598 |
| Thais | 100.0 /100 | #7 | Exceptional $47,577 |
| Iranians | 100.0 /100 | #8 | Exceptional $47,421 |
| Immigrants | Iran | 100.0 /100 | #9 | Exceptional $47,154 |
| Immigrants | China | 100.0 /100 | #10 | Exceptional $46,972 |
| Okinawans | 100.0 /100 | #11 | Exceptional $46,905 |
| Immigrants | Israel | 100.0 /100 | #12 | Exceptional $46,902 |
| Immigrants | Australia | 100.0 /100 | #13 | Exceptional $46,573 |
| Soviet Union | 100.0 /100 | #14 | Exceptional $46,556 |
| Immigrants | Eastern Asia | 100.0 /100 | #15 | Exceptional $46,502 |
| Indians (Asian) | 100.0 /100 | #16 | Exceptional $46,481 |
| Immigrants | South Central Asia | 100.0 /100 | #17 | Exceptional $46,324 |
| Cypriots | 100.0 /100 | #18 | Exceptional $45,570 |
| Eastern Europeans | 100.0 /100 | #19 | Exceptional $45,385 |
| Immigrants | Japan | 100.0 /100 | #20 | Exceptional $45,323 |
| Cambodians | 100.0 /100 | #21 | Exceptional $45,014 |