Houma vs Immigrants from Armenia Median Female Earnings
COMPARE
Houma
Immigrants from Armenia
Median Female Earnings
Median Female Earnings Comparison
Houma
Immigrants from Armenia
$30,343
MEDIAN FEMALE EARNINGS
0.0/ 100
METRIC RATING
347th/ 347
METRIC RANK
$40,340
MEDIAN FEMALE EARNINGS
79.2/ 100
METRIC RATING
151st/ 347
METRIC RANK
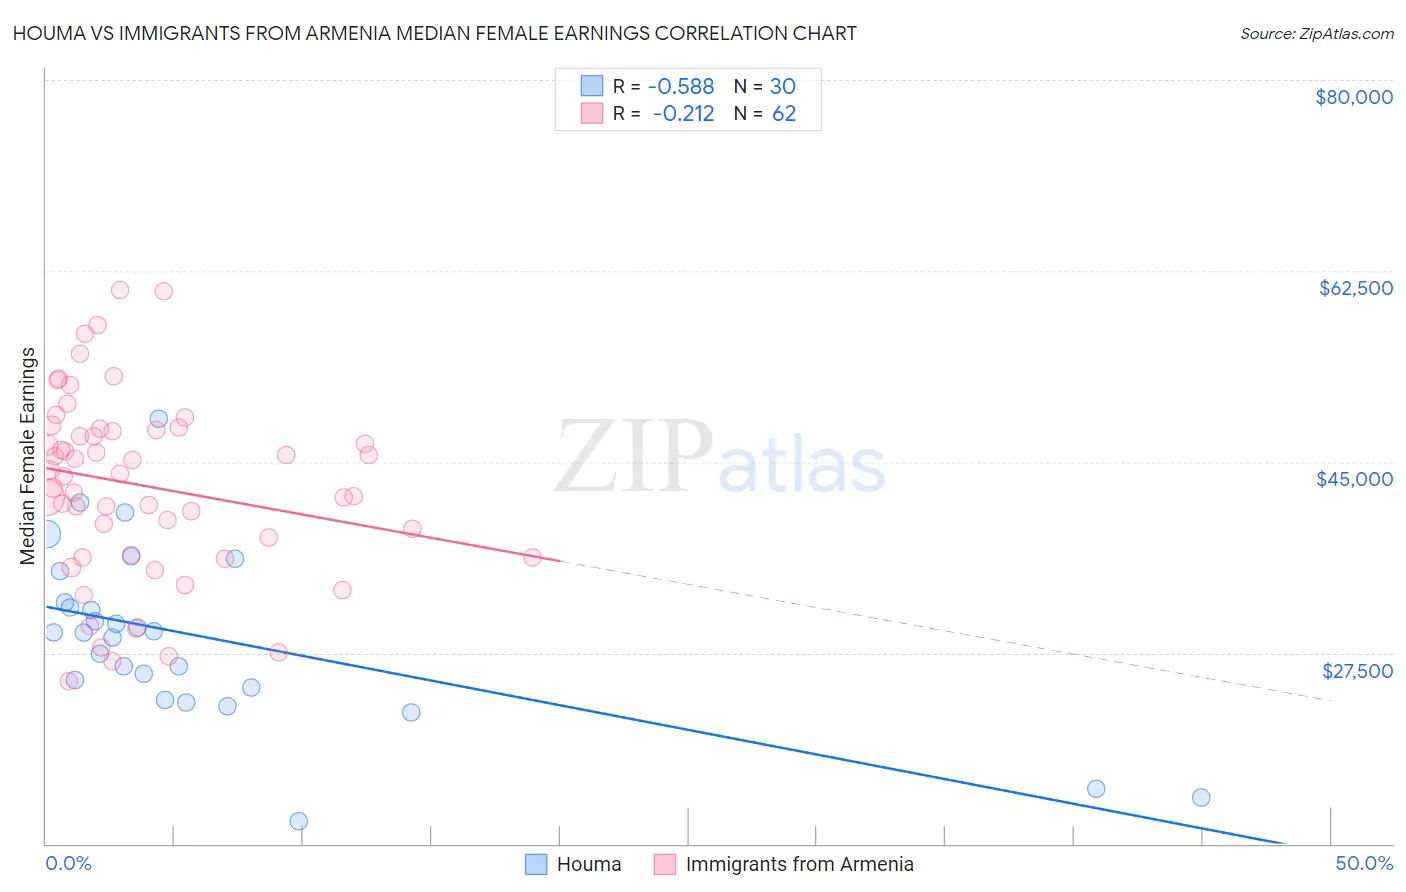
Houma vs Immigrants from Armenia Median Female Earnings Correlation Chart
The statistical analysis conducted on geographies consisting of 36,795,297 people shows a substantial negative correlation between the proportion of Houma and median female earnings in the United States with a correlation coefficient (R) of -0.588 and weighted average of $30,343. Similarly, the statistical analysis conducted on geographies consisting of 97,714,677 people shows a weak negative correlation between the proportion of Immigrants from Armenia and median female earnings in the United States with a correlation coefficient (R) of -0.212 and weighted average of $40,340, a difference of 33.0%.
Median Female Earnings Correlation Summary
| Measurement | Houma | Immigrants from Armenia |
| Minimum | $12,038 | $24,884 |
| Maximum | $48,900 | $60,766 |
| Range | $36,862 | $35,882 |
| Mean | $28,868 | $42,818 |
| Median | $29,403 | $43,807 |
| Interquartile 25% (IQ1) | $24,292 | $36,510 |
| Interquartile 75% (IQ3) | $32,114 | $47,965 |
| Interquartile Range (IQR) | $7,822 | $11,455 |
| Standard Deviation (Sample) | $8,016 | $8,342 |
| Standard Deviation (Population) | $7,881 | $8,274 |
Similar Demographics by Median Female Earnings
Demographics Similar to Houma by Median Female Earnings
In terms of median female earnings, the demographic groups most similar to Houma are Arapaho ($31,489, a difference of 3.8%), Puerto Rican ($31,560, a difference of 4.0%), Lumbee ($32,500, a difference of 7.1%), Pueblo ($32,564, a difference of 7.3%), and Yup'ik ($32,730, a difference of 7.9%).
| Demographics | Rating | Rank | Median Female Earnings |
| Mexicans | 0.0 /100 | #333 | Tragic $33,664 |
| Spanish American Indians | 0.0 /100 | #334 | Tragic $33,625 |
| Creek | 0.0 /100 | #335 | Tragic $33,437 |
| Ottawa | 0.0 /100 | #336 | Tragic $33,378 |
| Yakama | 0.0 /100 | #337 | Tragic $33,354 |
| Immigrants | Cuba | 0.0 /100 | #338 | Tragic $33,291 |
| Immigrants | Mexico | 0.0 /100 | #339 | Tragic $33,236 |
| Tohono O'odham | 0.0 /100 | #340 | Tragic $33,205 |
| Navajo | 0.0 /100 | #341 | Tragic $33,046 |
| Yup'ik | 0.0 /100 | #342 | Tragic $32,730 |
| Pueblo | 0.0 /100 | #343 | Tragic $32,564 |
| Lumbee | 0.0 /100 | #344 | Tragic $32,500 |
| Puerto Ricans | 0.0 /100 | #345 | Tragic $31,560 |
| Arapaho | 0.0 /100 | #346 | Tragic $31,489 |
| Houma | 0.0 /100 | #347 | Tragic $30,343 |
Demographics Similar to Immigrants from Armenia by Median Female Earnings
In terms of median female earnings, the demographic groups most similar to Immigrants from Armenia are Immigrants from Cameroon ($40,354, a difference of 0.030%), Immigrants from Chile ($40,353, a difference of 0.030%), West Indian ($40,317, a difference of 0.060%), Polish ($40,371, a difference of 0.080%), and Vietnamese ($40,377, a difference of 0.090%).
| Demographics | Rating | Rank | Median Female Earnings |
| Immigrants | North Macedonia | 83.8 /100 | #144 | Excellent $40,488 |
| Brazilians | 83.6 /100 | #145 | Excellent $40,483 |
| Ghanaians | 82.1 /100 | #146 | Excellent $40,429 |
| Vietnamese | 80.4 /100 | #147 | Excellent $40,377 |
| Poles | 80.2 /100 | #148 | Excellent $40,371 |
| Immigrants | Cameroon | 79.7 /100 | #149 | Good $40,354 |
| Immigrants | Chile | 79.6 /100 | #150 | Good $40,353 |
| Immigrants | Armenia | 79.2 /100 | #151 | Good $40,340 |
| West Indians | 78.4 /100 | #152 | Good $40,317 |
| British West Indians | 77.7 /100 | #153 | Good $40,299 |
| Immigrants | Oceania | 77.6 /100 | #154 | Good $40,297 |
| Immigrants | Africa | 76.2 /100 | #155 | Good $40,257 |
| Peruvians | 75.3 /100 | #156 | Good $40,234 |
| Portuguese | 73.0 /100 | #157 | Good $40,177 |
| Immigrants | Senegal | 72.2 /100 | #158 | Good $40,157 |