Senegalese vs Immigrants from Hong Kong Median Female Earnings
COMPARE
Senegalese
Immigrants from Hong Kong
Median Female Earnings
Median Female Earnings Comparison
Senegalese
Immigrants from Hong Kong
$39,384
MEDIAN FEMALE EARNINGS
34.2/ 100
METRIC RATING
189th/ 347
METRIC RANK
$49,818
MEDIAN FEMALE EARNINGS
100.0/ 100
METRIC RATING
1st/ 347
METRIC RANK
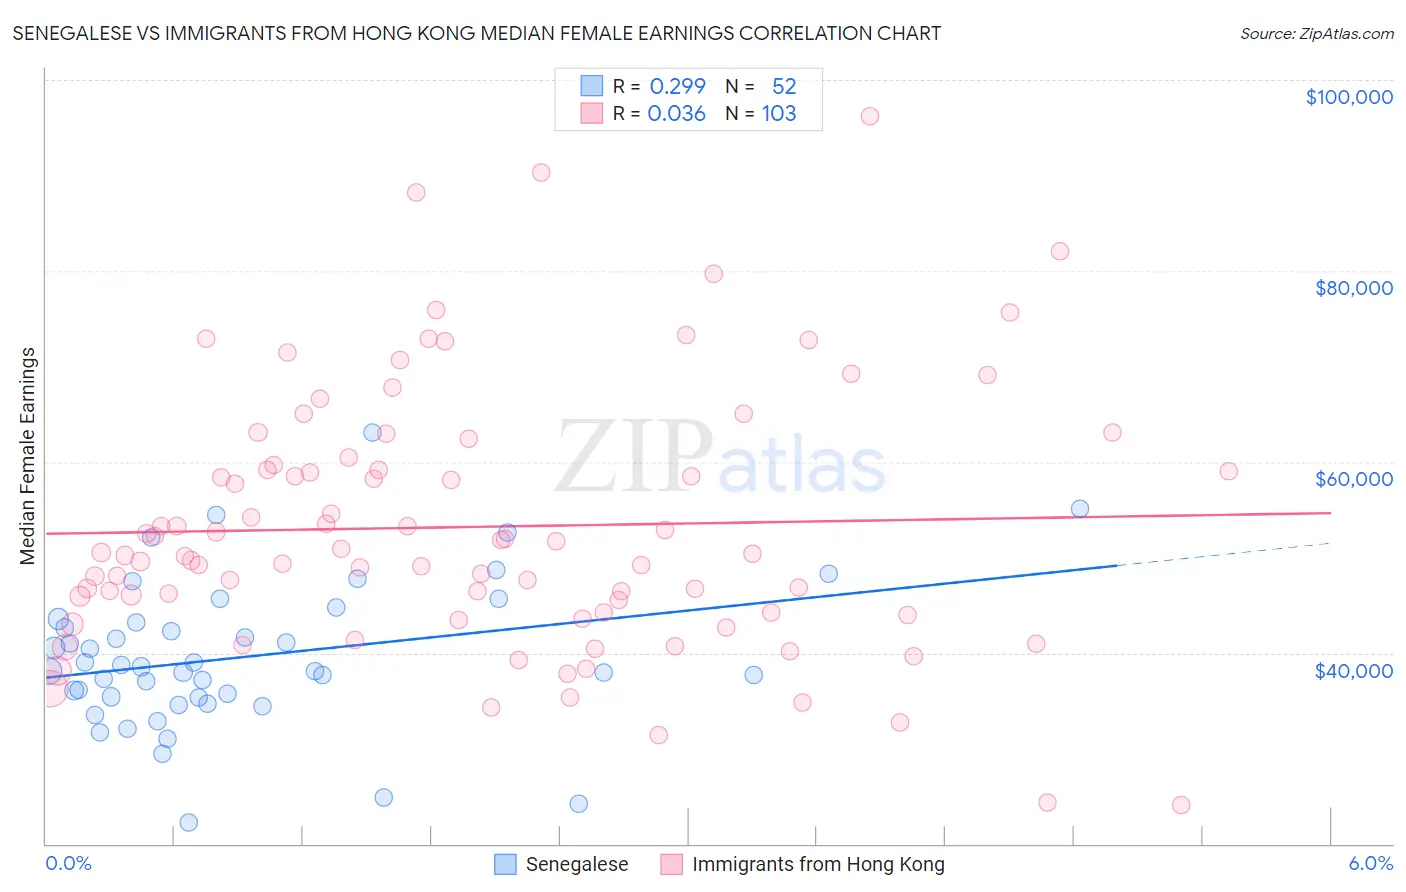
Senegalese vs Immigrants from Hong Kong Median Female Earnings Correlation Chart
The statistical analysis conducted on geographies consisting of 78,104,317 people shows a weak positive correlation between the proportion of Senegalese and median female earnings in the United States with a correlation coefficient (R) of 0.299 and weighted average of $39,384. Similarly, the statistical analysis conducted on geographies consisting of 253,932,744 people shows no correlation between the proportion of Immigrants from Hong Kong and median female earnings in the United States with a correlation coefficient (R) of 0.036 and weighted average of $49,818, a difference of 26.5%.
Median Female Earnings Correlation Summary
| Measurement | Senegalese | Immigrants from Hong Kong |
| Minimum | $22,259 | $24,038 |
| Maximum | $63,050 | $96,250 |
| Range | $40,791 | $72,212 |
| Mean | $39,635 | $53,195 |
| Median | $38,318 | $50,354 |
| Interquartile 25% (IQ1) | $35,367 | $44,209 |
| Interquartile 75% (IQ3) | $43,341 | $59,618 |
| Interquartile Range (IQR) | $7,973 | $15,409 |
| Standard Deviation (Sample) | $7,802 | $13,646 |
| Standard Deviation (Population) | $7,727 | $13,580 |
Similar Demographics by Median Female Earnings
Demographics Similar to Senegalese by Median Female Earnings
In terms of median female earnings, the demographic groups most similar to Senegalese are Puget Sound Salish ($39,376, a difference of 0.020%), Immigrants from Western Africa ($39,351, a difference of 0.080%), Swedish ($39,421, a difference of 0.090%), Bermudan ($39,418, a difference of 0.090%), and Immigrants from West Indies ($39,441, a difference of 0.14%).
| Demographics | Rating | Rank | Median Female Earnings |
| Tlingit-Haida | 40.5 /100 | #182 | Average $39,513 |
| Hungarians | 40.3 /100 | #183 | Average $39,510 |
| Europeans | 37.7 /100 | #184 | Fair $39,457 |
| Immigrants | West Indies | 36.9 /100 | #185 | Fair $39,441 |
| Colombians | 36.9 /100 | #186 | Fair $39,439 |
| Swedes | 36.0 /100 | #187 | Fair $39,421 |
| Bermudans | 35.9 /100 | #188 | Fair $39,418 |
| Senegalese | 34.2 /100 | #189 | Fair $39,384 |
| Puget Sound Salish | 33.9 /100 | #190 | Fair $39,376 |
| Immigrants | Western Africa | 32.7 /100 | #191 | Fair $39,351 |
| Immigrants | Immigrants | 31.7 /100 | #192 | Fair $39,328 |
| Immigrants | Nigeria | 30.2 /100 | #193 | Fair $39,294 |
| Irish | 30.0 /100 | #194 | Fair $39,291 |
| Uruguayans | 27.3 /100 | #195 | Fair $39,228 |
| Immigrants | Costa Rica | 25.6 /100 | #196 | Fair $39,186 |
Demographics Similar to Immigrants from Hong Kong by Median Female Earnings
In terms of median female earnings, the demographic groups most similar to Immigrants from Hong Kong are Filipino ($49,508, a difference of 0.63%), Immigrants from Taiwan ($49,256, a difference of 1.1%), Immigrants from India ($48,292, a difference of 3.2%), Immigrants from Singapore ($47,986, a difference of 3.8%), and Immigrants from Ireland ($47,598, a difference of 4.7%).
| Demographics | Rating | Rank | Median Female Earnings |
| Immigrants | Hong Kong | 100.0 /100 | #1 | Exceptional $49,818 |
| Filipinos | 100.0 /100 | #2 | Exceptional $49,508 |
| Immigrants | Taiwan | 100.0 /100 | #3 | Exceptional $49,256 |
| Immigrants | India | 100.0 /100 | #4 | Exceptional $48,292 |
| Immigrants | Singapore | 100.0 /100 | #5 | Exceptional $47,986 |
| Immigrants | Ireland | 100.0 /100 | #6 | Exceptional $47,598 |
| Thais | 100.0 /100 | #7 | Exceptional $47,577 |
| Iranians | 100.0 /100 | #8 | Exceptional $47,421 |
| Immigrants | Iran | 100.0 /100 | #9 | Exceptional $47,154 |
| Immigrants | China | 100.0 /100 | #10 | Exceptional $46,972 |
| Okinawans | 100.0 /100 | #11 | Exceptional $46,905 |
| Immigrants | Israel | 100.0 /100 | #12 | Exceptional $46,902 |
| Immigrants | Australia | 100.0 /100 | #13 | Exceptional $46,573 |
| Soviet Union | 100.0 /100 | #14 | Exceptional $46,556 |
| Immigrants | Eastern Asia | 100.0 /100 | #15 | Exceptional $46,502 |