Houma vs Immigrants from Hong Kong Associate's Degree
COMPARE
Houma
Immigrants from Hong Kong
Associate's Degree
Associate's Degree Comparison
Houma
Immigrants from Hong Kong
28.2%
ASSOCIATE'S DEGREE
0.0/ 100
METRIC RATING
346th/ 347
METRIC RANK
55.4%
ASSOCIATE'S DEGREE
100.0/ 100
METRIC RATING
14th/ 347
METRIC RANK
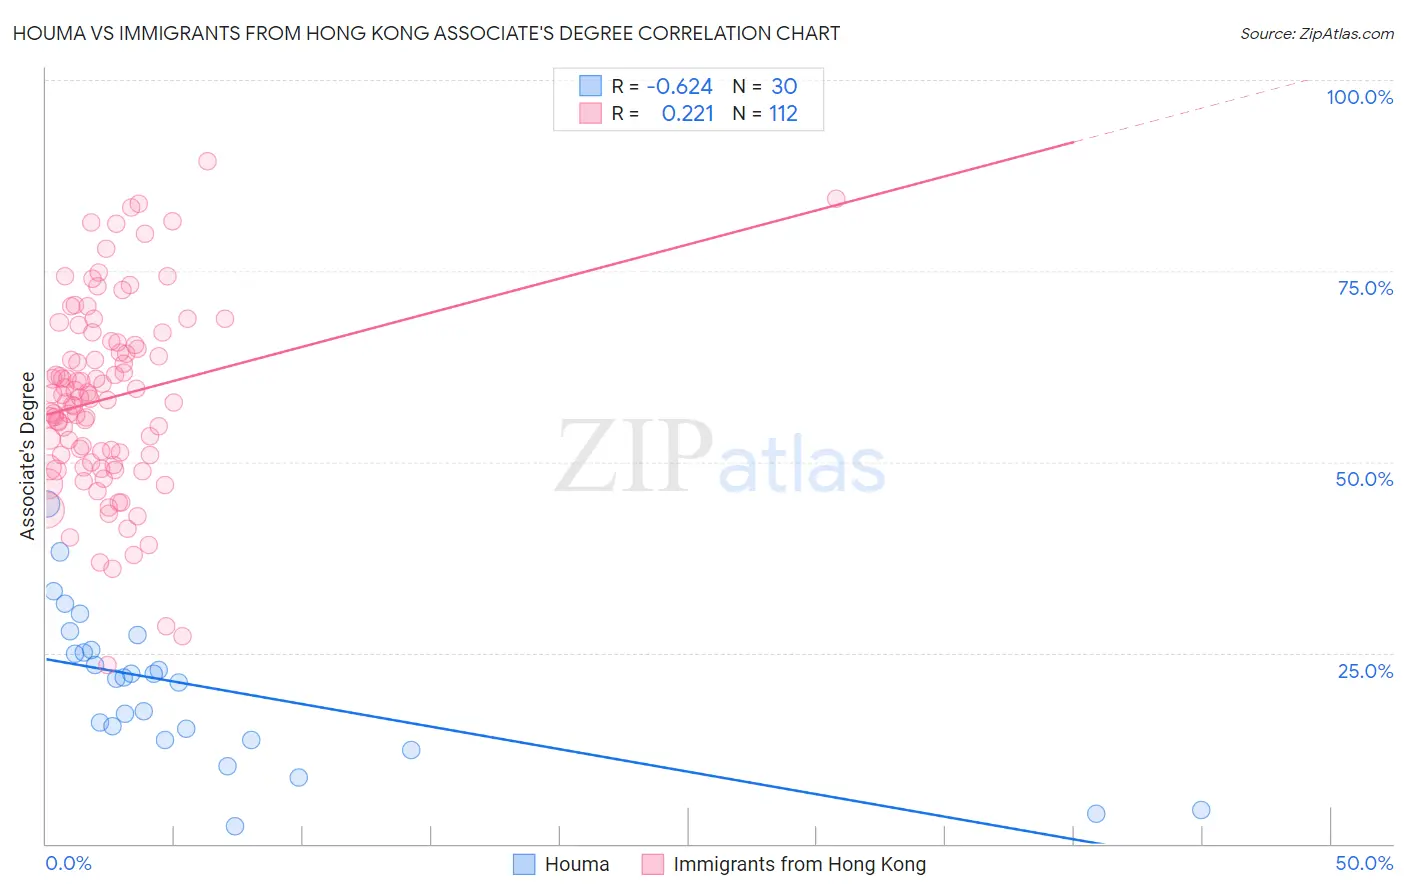
Houma vs Immigrants from Hong Kong Associate's Degree Correlation Chart
The statistical analysis conducted on geographies consisting of 36,792,820 people shows a significant negative correlation between the proportion of Houma and percentage of population with at least associate's degree education in the United States with a correlation coefficient (R) of -0.624 and weighted average of 28.2%. Similarly, the statistical analysis conducted on geographies consisting of 253,990,250 people shows a weak positive correlation between the proportion of Immigrants from Hong Kong and percentage of population with at least associate's degree education in the United States with a correlation coefficient (R) of 0.221 and weighted average of 55.4%, a difference of 96.4%.
Associate's Degree Correlation Summary
| Measurement | Houma | Immigrants from Hong Kong |
| Minimum | 2.4% | 23.3% |
| Maximum | 44.5% | 89.4% |
| Range | 42.2% | 66.0% |
| Mean | 20.4% | 58.3% |
| Median | 21.7% | 58.4% |
| Interquartile 25% (IQ1) | 13.5% | 50.4% |
| Interquartile 75% (IQ3) | 25.3% | 65.4% |
| Interquartile Range (IQR) | 11.8% | 15.1% |
| Standard Deviation (Sample) | 9.9% | 12.4% |
| Standard Deviation (Population) | 9.7% | 12.4% |
Similar Demographics by Associate's Degree
Demographics Similar to Houma by Associate's Degree
In terms of associate's degree, the demographic groups most similar to Houma are Pima (30.2%, a difference of 7.2%), Yuman (31.3%, a difference of 10.8%), Tohono O'odham (31.8%, a difference of 12.7%), Yup'ik (25.0%, a difference of 13.0%), and Yakama (32.3%, a difference of 14.6%).
| Demographics | Rating | Rank | Associate's Degree |
| Mexicans | 0.0 /100 | #333 | Tragic 35.0% |
| Natives/Alaskans | 0.0 /100 | #334 | Tragic 34.9% |
| Spanish American Indians | 0.0 /100 | #335 | Tragic 34.9% |
| Hopi | 0.0 /100 | #336 | Tragic 34.6% |
| Lumbee | 0.0 /100 | #337 | Tragic 34.1% |
| Pueblo | 0.0 /100 | #338 | Tragic 34.0% |
| Immigrants | Mexico | 0.0 /100 | #339 | Tragic 33.7% |
| Navajo | 0.0 /100 | #340 | Tragic 32.6% |
| Inupiat | 0.0 /100 | #341 | Tragic 32.6% |
| Yakama | 0.0 /100 | #342 | Tragic 32.3% |
| Tohono O'odham | 0.0 /100 | #343 | Tragic 31.8% |
| Yuman | 0.0 /100 | #344 | Tragic 31.3% |
| Pima | 0.0 /100 | #345 | Tragic 30.2% |
| Houma | 0.0 /100 | #346 | Tragic 28.2% |
| Yup'ik | 0.0 /100 | #347 | Tragic 25.0% |
Demographics Similar to Immigrants from Hong Kong by Associate's Degree
In terms of associate's degree, the demographic groups most similar to Immigrants from Hong Kong are Immigrants from Eastern Asia (55.4%, a difference of 0.030%), Immigrants from China (55.5%, a difference of 0.14%), Soviet Union (55.1%, a difference of 0.50%), Immigrants from South Central Asia (55.7%, a difference of 0.63%), and Eastern European (55.0%, a difference of 0.64%).
| Demographics | Rating | Rank | Associate's Degree |
| Immigrants | Iran | 100.0 /100 | #7 | Exceptional 57.7% |
| Thais | 100.0 /100 | #8 | Exceptional 57.4% |
| Immigrants | Israel | 100.0 /100 | #9 | Exceptional 56.8% |
| Cypriots | 100.0 /100 | #10 | Exceptional 56.4% |
| Immigrants | Australia | 100.0 /100 | #11 | Exceptional 55.8% |
| Immigrants | South Central Asia | 100.0 /100 | #12 | Exceptional 55.7% |
| Immigrants | China | 100.0 /100 | #13 | Exceptional 55.5% |
| Immigrants | Hong Kong | 100.0 /100 | #14 | Exceptional 55.4% |
| Immigrants | Eastern Asia | 100.0 /100 | #15 | Exceptional 55.4% |
| Soviet Union | 100.0 /100 | #16 | Exceptional 55.1% |
| Eastern Europeans | 100.0 /100 | #17 | Exceptional 55.0% |
| Indians (Asian) | 100.0 /100 | #18 | Exceptional 54.8% |
| Immigrants | Ireland | 100.0 /100 | #19 | Exceptional 54.7% |
| Cambodians | 100.0 /100 | #20 | Exceptional 54.6% |
| Immigrants | Sweden | 100.0 /100 | #21 | Exceptional 54.6% |