Houma vs Immigrants from Micronesia Median Female Earnings
COMPARE
Houma
Immigrants from Micronesia
Median Female Earnings
Median Female Earnings Comparison
Houma
Immigrants from Micronesia
$30,343
MEDIAN FEMALE EARNINGS
0.0/ 100
METRIC RATING
347th/ 347
METRIC RANK
$35,477
MEDIAN FEMALE EARNINGS
0.0/ 100
METRIC RATING
298th/ 347
METRIC RANK
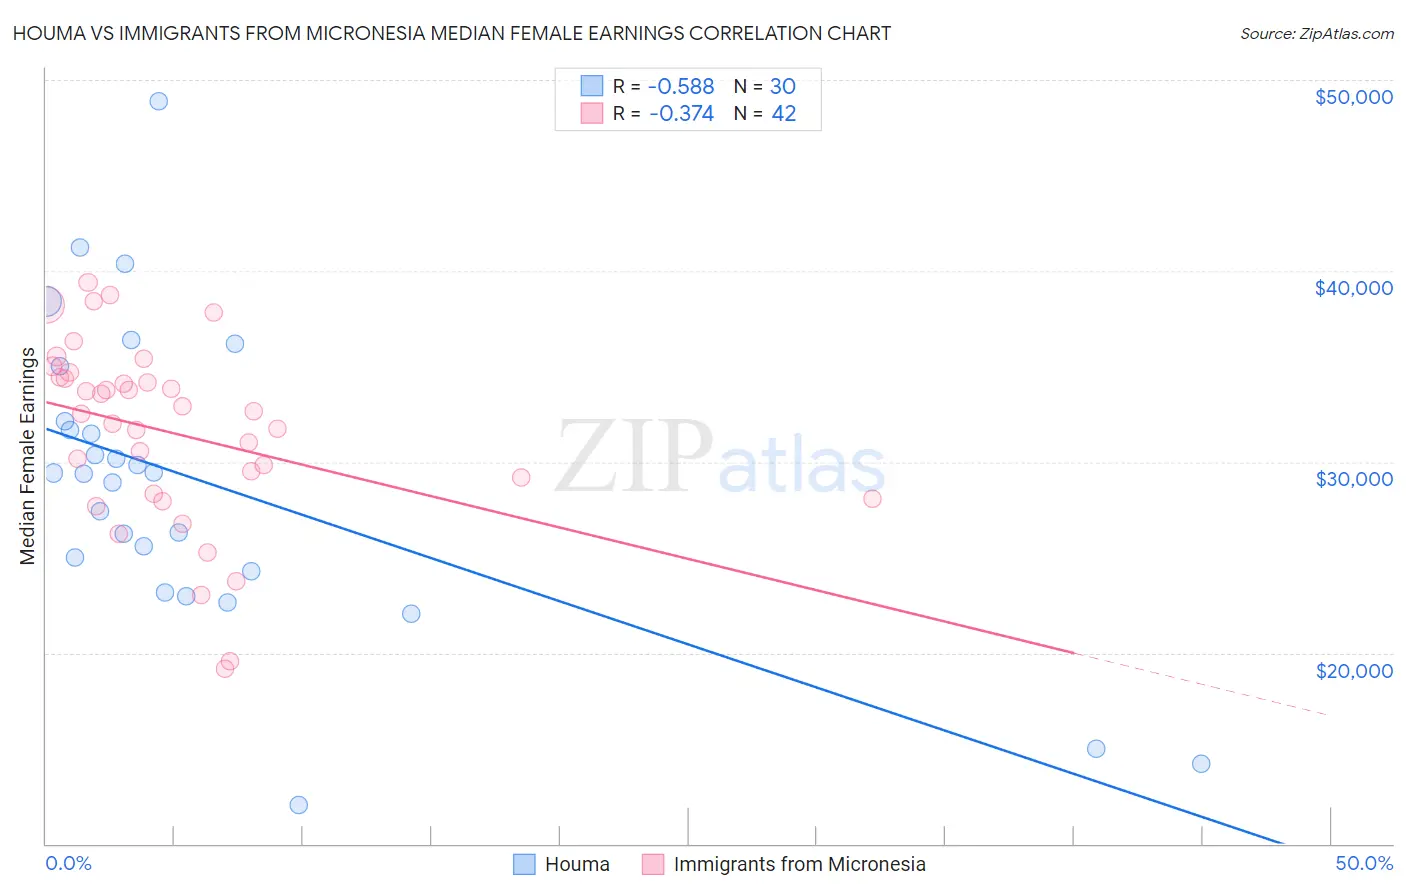
Houma vs Immigrants from Micronesia Median Female Earnings Correlation Chart
The statistical analysis conducted on geographies consisting of 36,795,297 people shows a substantial negative correlation between the proportion of Houma and median female earnings in the United States with a correlation coefficient (R) of -0.588 and weighted average of $30,343. Similarly, the statistical analysis conducted on geographies consisting of 61,601,305 people shows a mild negative correlation between the proportion of Immigrants from Micronesia and median female earnings in the United States with a correlation coefficient (R) of -0.374 and weighted average of $35,477, a difference of 16.9%.
Median Female Earnings Correlation Summary
| Measurement | Houma | Immigrants from Micronesia |
| Minimum | $12,038 | $19,167 |
| Maximum | $48,900 | $39,412 |
| Range | $36,862 | $20,245 |
| Mean | $28,868 | $31,538 |
| Median | $29,403 | $32,587 |
| Interquartile 25% (IQ1) | $24,292 | $28,333 |
| Interquartile 75% (IQ3) | $32,114 | $34,418 |
| Interquartile Range (IQR) | $7,822 | $6,085 |
| Standard Deviation (Sample) | $8,016 | $4,851 |
| Standard Deviation (Population) | $7,881 | $4,793 |
Similar Demographics by Median Female Earnings
Demographics Similar to Houma by Median Female Earnings
In terms of median female earnings, the demographic groups most similar to Houma are Arapaho ($31,489, a difference of 3.8%), Puerto Rican ($31,560, a difference of 4.0%), Lumbee ($32,500, a difference of 7.1%), Pueblo ($32,564, a difference of 7.3%), and Yup'ik ($32,730, a difference of 7.9%).
| Demographics | Rating | Rank | Median Female Earnings |
| Mexicans | 0.0 /100 | #333 | Tragic $33,664 |
| Spanish American Indians | 0.0 /100 | #334 | Tragic $33,625 |
| Creek | 0.0 /100 | #335 | Tragic $33,437 |
| Ottawa | 0.0 /100 | #336 | Tragic $33,378 |
| Yakama | 0.0 /100 | #337 | Tragic $33,354 |
| Immigrants | Cuba | 0.0 /100 | #338 | Tragic $33,291 |
| Immigrants | Mexico | 0.0 /100 | #339 | Tragic $33,236 |
| Tohono O'odham | 0.0 /100 | #340 | Tragic $33,205 |
| Navajo | 0.0 /100 | #341 | Tragic $33,046 |
| Yup'ik | 0.0 /100 | #342 | Tragic $32,730 |
| Pueblo | 0.0 /100 | #343 | Tragic $32,564 |
| Lumbee | 0.0 /100 | #344 | Tragic $32,500 |
| Puerto Ricans | 0.0 /100 | #345 | Tragic $31,560 |
| Arapaho | 0.0 /100 | #346 | Tragic $31,489 |
| Houma | 0.0 /100 | #347 | Tragic $30,343 |
Demographics Similar to Immigrants from Micronesia by Median Female Earnings
In terms of median female earnings, the demographic groups most similar to Immigrants from Micronesia are Hmong ($35,498, a difference of 0.060%), Immigrants from Guatemala ($35,444, a difference of 0.090%), Yuman ($35,377, a difference of 0.28%), Mexican American Indian ($35,629, a difference of 0.43%), and Pima ($35,326, a difference of 0.43%).
| Demographics | Rating | Rank | Median Female Earnings |
| Blackfeet | 0.0 /100 | #291 | Tragic $35,864 |
| Americans | 0.0 /100 | #292 | Tragic $35,777 |
| Guatemalans | 0.0 /100 | #293 | Tragic $35,695 |
| Cheyenne | 0.0 /100 | #294 | Tragic $35,673 |
| Comanche | 0.0 /100 | #295 | Tragic $35,661 |
| Mexican American Indians | 0.0 /100 | #296 | Tragic $35,629 |
| Hmong | 0.0 /100 | #297 | Tragic $35,498 |
| Immigrants | Micronesia | 0.0 /100 | #298 | Tragic $35,477 |
| Immigrants | Guatemala | 0.0 /100 | #299 | Tragic $35,444 |
| Yuman | 0.0 /100 | #300 | Tragic $35,377 |
| Pima | 0.0 /100 | #301 | Tragic $35,326 |
| Blacks/African Americans | 0.0 /100 | #302 | Tragic $35,315 |
| Immigrants | Latin America | 0.0 /100 | #303 | Tragic $35,307 |
| Crow | 0.0 /100 | #304 | Tragic $35,266 |
| Bahamians | 0.0 /100 | #305 | Tragic $35,125 |