Guamanian/Chamorro vs Alaska Native Associate's Degree
COMPARE
Guamanian/Chamorro
Alaska Native
Associate's Degree
Associate's Degree Comparison
Guamanians/Chamorros
Alaska Natives
43.8%
ASSOCIATE'S DEGREE
4.8/ 100
METRIC RATING
225th/ 347
METRIC RANK
37.5%
ASSOCIATE'S DEGREE
0.0/ 100
METRIC RATING
318th/ 347
METRIC RANK
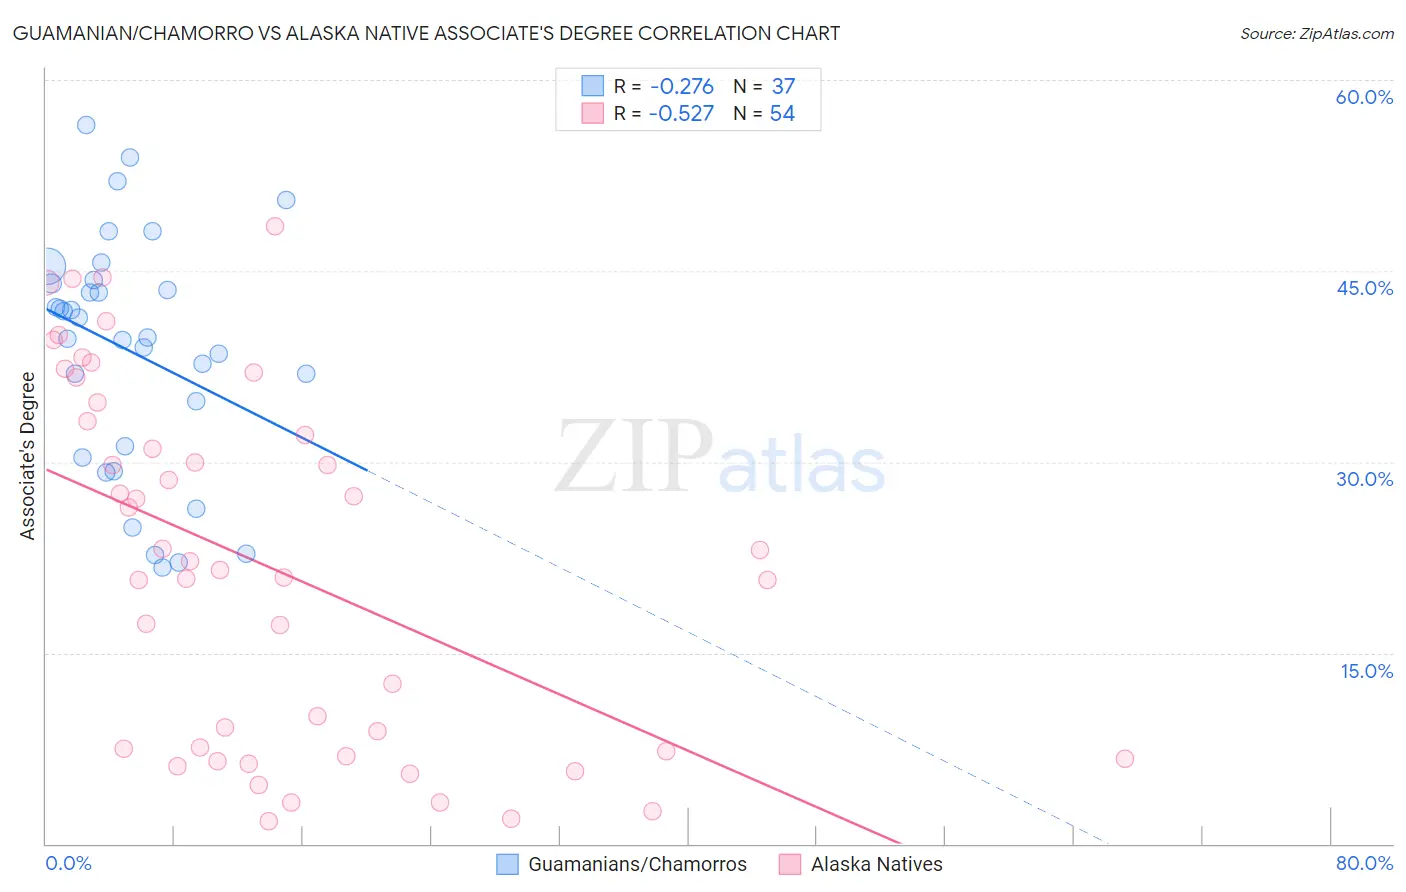
Guamanian/Chamorro vs Alaska Native Associate's Degree Correlation Chart
The statistical analysis conducted on geographies consisting of 221,965,027 people shows a weak negative correlation between the proportion of Guamanians/Chamorros and percentage of population with at least associate's degree education in the United States with a correlation coefficient (R) of -0.276 and weighted average of 43.8%. Similarly, the statistical analysis conducted on geographies consisting of 76,777,220 people shows a substantial negative correlation between the proportion of Alaska Natives and percentage of population with at least associate's degree education in the United States with a correlation coefficient (R) of -0.527 and weighted average of 37.5%, a difference of 16.8%.
Associate's Degree Correlation Summary
| Measurement | Guamanian/Chamorro | Alaska Native |
| Minimum | 21.7% | 1.8% |
| Maximum | 56.4% | 48.5% |
| Range | 34.7% | 46.7% |
| Mean | 38.7% | 21.8% |
| Median | 39.8% | 21.9% |
| Interquartile 25% (IQ1) | 30.8% | 7.3% |
| Interquartile 75% (IQ3) | 44.1% | 33.2% |
| Interquartile Range (IQR) | 13.4% | 25.9% |
| Standard Deviation (Sample) | 9.2% | 14.0% |
| Standard Deviation (Population) | 9.1% | 13.9% |
Similar Demographics by Associate's Degree
Demographics Similar to Guamanians/Chamorros by Associate's Degree
In terms of associate's degree, the demographic groups most similar to Guamanians/Chamorros are West Indian (43.8%, a difference of 0.15%), Immigrants from Burma/Myanmar (43.7%, a difference of 0.22%), Subsaharan African (43.9%, a difference of 0.29%), Barbadian (43.9%, a difference of 0.39%), and Trinidadian and Tobagonian (43.6%, a difference of 0.39%).
| Demographics | Rating | Rank | Associate's Degree |
| Spanish | 9.4 /100 | #218 | Tragic 44.4% |
| Whites/Caucasians | 7.5 /100 | #219 | Tragic 44.2% |
| Portuguese | 7.2 /100 | #220 | Tragic 44.1% |
| Immigrants | Western Africa | 6.6 /100 | #221 | Tragic 44.1% |
| Barbadians | 5.8 /100 | #222 | Tragic 43.9% |
| Sub-Saharan Africans | 5.5 /100 | #223 | Tragic 43.9% |
| West Indians | 5.2 /100 | #224 | Tragic 43.8% |
| Guamanians/Chamorros | 4.8 /100 | #225 | Tragic 43.8% |
| Immigrants | Burma/Myanmar | 4.3 /100 | #226 | Tragic 43.7% |
| Trinidadians and Tobagonians | 4.0 /100 | #227 | Tragic 43.6% |
| Hmong | 3.2 /100 | #228 | Tragic 43.4% |
| Immigrants | Trinidad and Tobago | 3.0 /100 | #229 | Tragic 43.3% |
| Immigrants | Barbados | 2.9 /100 | #230 | Tragic 43.3% |
| Liberians | 2.9 /100 | #231 | Tragic 43.3% |
| Native Hawaiians | 2.3 /100 | #232 | Tragic 43.1% |
Demographics Similar to Alaska Natives by Associate's Degree
In terms of associate's degree, the demographic groups most similar to Alaska Natives are Fijian (37.4%, a difference of 0.22%), Yaqui (37.6%, a difference of 0.23%), Crow (37.6%, a difference of 0.25%), Cajun (37.4%, a difference of 0.25%), and Creek (37.6%, a difference of 0.26%).
| Demographics | Rating | Rank | Associate's Degree |
| Immigrants | Latin America | 0.0 /100 | #311 | Tragic 37.9% |
| Choctaw | 0.0 /100 | #312 | Tragic 37.8% |
| Hispanics or Latinos | 0.0 /100 | #313 | Tragic 37.7% |
| Seminole | 0.0 /100 | #314 | Tragic 37.7% |
| Creek | 0.0 /100 | #315 | Tragic 37.6% |
| Crow | 0.0 /100 | #316 | Tragic 37.6% |
| Yaqui | 0.0 /100 | #317 | Tragic 37.6% |
| Alaska Natives | 0.0 /100 | #318 | Tragic 37.5% |
| Fijians | 0.0 /100 | #319 | Tragic 37.4% |
| Cajuns | 0.0 /100 | #320 | Tragic 37.4% |
| Immigrants | Yemen | 0.0 /100 | #321 | Tragic 37.3% |
| Pennsylvania Germans | 0.0 /100 | #322 | Tragic 37.2% |
| Immigrants | Cabo Verde | 0.0 /100 | #323 | Tragic 36.8% |
| Arapaho | 0.0 /100 | #324 | Tragic 36.7% |
| Menominee | 0.0 /100 | #325 | Tragic 36.7% |