Serbian vs Alaska Native Householder Income Over 65 years
COMPARE
Serbian
Alaska Native
Householder Income Over 65 years
Householder Income Over 65 years Comparison
Serbians
Alaska Natives
$61,087
HOUSEHOLDER INCOME OVER 65 YEARS
53.1/ 100
METRIC RATING
170th/ 347
METRIC RANK
$60,748
HOUSEHOLDER INCOME OVER 65 YEARS
44.3/ 100
METRIC RATING
177th/ 347
METRIC RANK
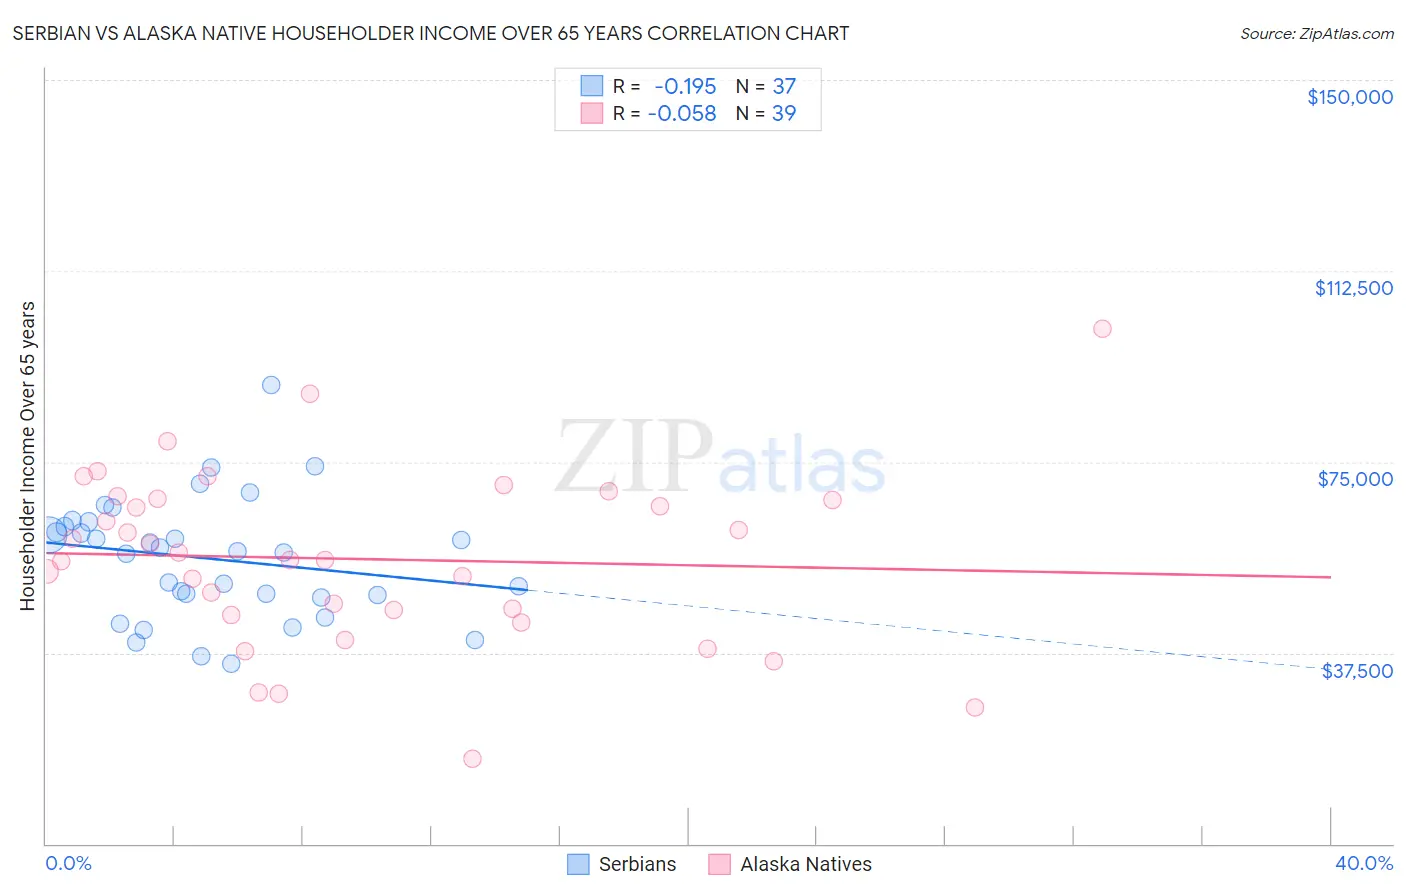
Serbian vs Alaska Native Householder Income Over 65 years Correlation Chart
The statistical analysis conducted on geographies consisting of 267,254,398 people shows a poor negative correlation between the proportion of Serbians and household income with householder over the age of 65 in the United States with a correlation coefficient (R) of -0.195 and weighted average of $61,087. Similarly, the statistical analysis conducted on geographies consisting of 76,616,982 people shows a slight negative correlation between the proportion of Alaska Natives and household income with householder over the age of 65 in the United States with a correlation coefficient (R) of -0.058 and weighted average of $60,748, a difference of 0.56%.
Householder Income Over 65 years Correlation Summary
| Measurement | Serbian | Alaska Native |
| Minimum | $35,417 | $16,607 |
| Maximum | $89,997 | $101,250 |
| Range | $54,580 | $84,643 |
| Mean | $56,009 | $55,918 |
| Median | $57,358 | $55,808 |
| Interquartile 25% (IQ1) | $48,698 | $45,000 |
| Interquartile 75% (IQ3) | $62,751 | $67,644 |
| Interquartile Range (IQR) | $14,053 | $22,644 |
| Standard Deviation (Sample) | $11,788 | $17,265 |
| Standard Deviation (Population) | $11,628 | $17,043 |
Demographics Similar to Serbians and Alaska Natives by Householder Income Over 65 years
In terms of householder income over 65 years, the demographic groups most similar to Serbians are Carpatho Rusyn ($61,093, a difference of 0.010%), Irish ($61,097, a difference of 0.020%), Norwegian ($61,104, a difference of 0.030%), Inupiat ($61,061, a difference of 0.040%), and Immigrants from Poland ($61,041, a difference of 0.080%). Similarly, the demographic groups most similar to Alaska Natives are Yup'ik ($60,727, a difference of 0.030%), Spanish ($60,795, a difference of 0.080%), Welsh ($60,666, a difference of 0.14%), Immigrants from Morocco ($60,647, a difference of 0.17%), and Spaniard ($60,866, a difference of 0.19%).
| Demographics | Rating | Rank | Householder Income Over 65 years |
| Ugandans | 55.5 /100 | #163 | Average $61,177 |
| Immigrants | North Macedonia | 55.4 /100 | #164 | Average $61,175 |
| Immigrants | Ukraine | 55.1 /100 | #165 | Average $61,163 |
| Immigrants | Eastern Africa | 55.0 /100 | #166 | Average $61,157 |
| Norwegians | 53.6 /100 | #167 | Average $61,104 |
| Irish | 53.4 /100 | #168 | Average $61,097 |
| Carpatho Rusyns | 53.3 /100 | #169 | Average $61,093 |
| Serbians | 53.1 /100 | #170 | Average $61,087 |
| Inupiat | 52.4 /100 | #171 | Average $61,061 |
| Immigrants | Poland | 51.9 /100 | #172 | Average $61,041 |
| Immigrants | Micronesia | 50.8 /100 | #173 | Average $61,000 |
| Luxembourgers | 50.0 /100 | #174 | Average $60,967 |
| Spaniards | 47.3 /100 | #175 | Average $60,866 |
| Spanish | 45.5 /100 | #176 | Average $60,795 |
| Alaska Natives | 44.3 /100 | #177 | Average $60,748 |
| Yup'ik | 43.7 /100 | #178 | Average $60,727 |
| Welsh | 42.2 /100 | #179 | Average $60,666 |
| Immigrants | Morocco | 41.7 /100 | #180 | Average $60,647 |
| Celtics | 40.7 /100 | #181 | Average $60,608 |
| Czechoslovakians | 40.0 /100 | #182 | Average $60,581 |
| Kenyans | 38.4 /100 | #183 | Fair $60,514 |