Danish vs Lithuanian Per Capita Income
COMPARE
Danish
Lithuanian
Per Capita Income
Per Capita Income Comparison
Danes
Lithuanians
$44,095
PER CAPITA INCOME
61.9/ 100
METRIC RATING
160th/ 347
METRIC RANK
$49,448
PER CAPITA INCOME
99.8/ 100
METRIC RATING
68th/ 347
METRIC RANK
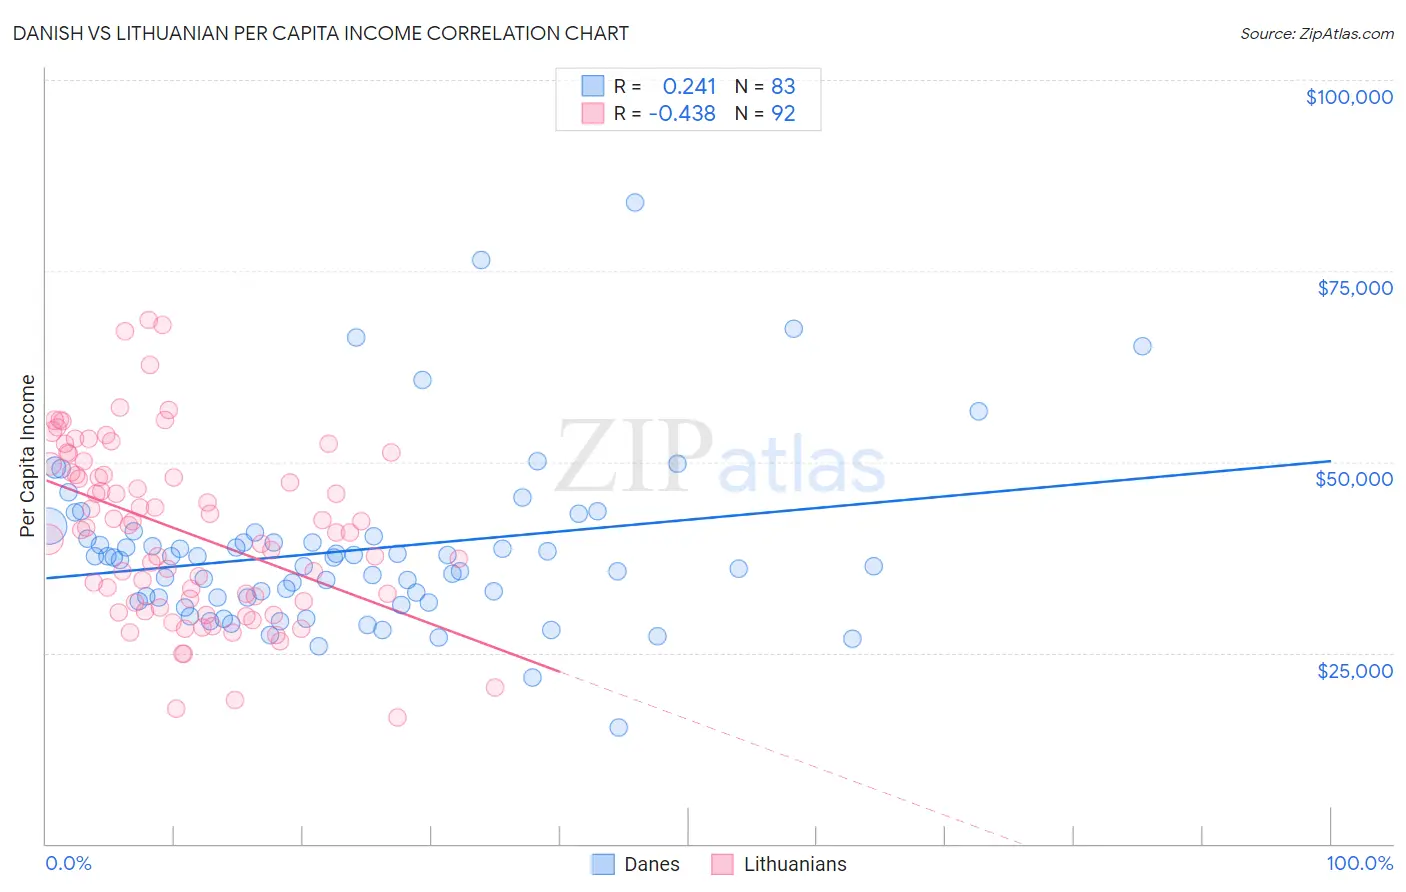
Danish vs Lithuanian Per Capita Income Correlation Chart
The statistical analysis conducted on geographies consisting of 474,208,442 people shows a weak positive correlation between the proportion of Danes and per capita income in the United States with a correlation coefficient (R) of 0.241 and weighted average of $44,095. Similarly, the statistical analysis conducted on geographies consisting of 421,963,914 people shows a moderate negative correlation between the proportion of Lithuanians and per capita income in the United States with a correlation coefficient (R) of -0.438 and weighted average of $49,448, a difference of 12.1%.
Per Capita Income Correlation Summary
| Measurement | Danish | Lithuanian |
| Minimum | $15,232 | $16,487 |
| Maximum | $83,892 | $68,542 |
| Range | $68,660 | $52,055 |
| Mean | $38,430 | $40,931 |
| Median | $37,481 | $41,220 |
| Interquartile 25% (IQ1) | $32,272 | $31,717 |
| Interquartile 75% (IQ3) | $40,294 | $49,156 |
| Interquartile Range (IQR) | $8,022 | $17,439 |
| Standard Deviation (Sample) | $11,196 | $11,469 |
| Standard Deviation (Population) | $11,128 | $11,406 |
Similar Demographics by Per Capita Income
Demographics Similar to Danes by Per Capita Income
In terms of per capita income, the demographic groups most similar to Danes are Costa Rican ($44,090, a difference of 0.010%), South American ($44,114, a difference of 0.040%), Swiss ($44,076, a difference of 0.040%), Immigrants from South America ($44,068, a difference of 0.060%), and Sri Lankan ($44,014, a difference of 0.18%).
| Demographics | Rating | Rank | Per Capita Income |
| Scottish | 70.6 /100 | #153 | Good $44,440 |
| Portuguese | 68.7 /100 | #154 | Good $44,362 |
| Uruguayans | 67.6 /100 | #155 | Good $44,318 |
| Slovaks | 65.4 /100 | #156 | Good $44,229 |
| South American Indians | 64.8 /100 | #157 | Good $44,206 |
| Immigrants | Nepal | 64.3 /100 | #158 | Good $44,187 |
| South Americans | 62.4 /100 | #159 | Good $44,114 |
| Danes | 61.9 /100 | #160 | Good $44,095 |
| Costa Ricans | 61.8 /100 | #161 | Good $44,090 |
| Swiss | 61.4 /100 | #162 | Good $44,076 |
| Immigrants | South America | 61.2 /100 | #163 | Good $44,068 |
| Sri Lankans | 59.8 /100 | #164 | Average $44,014 |
| Immigrants | Philippines | 59.4 /100 | #165 | Average $44,000 |
| Immigrants | Uruguay | 59.3 /100 | #166 | Average $43,997 |
| English | 58.9 /100 | #167 | Average $43,982 |
Demographics Similar to Lithuanians by Per Capita Income
In terms of per capita income, the demographic groups most similar to Lithuanians are Immigrants from Romania ($49,463, a difference of 0.030%), Immigrants from Bulgaria ($49,482, a difference of 0.070%), Immigrants from Canada ($49,412, a difference of 0.070%), Bolivian ($49,526, a difference of 0.16%), and Immigrants from Eastern Europe ($49,316, a difference of 0.27%).
| Demographics | Rating | Rank | Per Capita Income |
| Argentineans | 99.9 /100 | #61 | Exceptional $49,862 |
| Immigrants | Asia | 99.9 /100 | #62 | Exceptional $49,741 |
| Maltese | 99.9 /100 | #63 | Exceptional $49,640 |
| Immigrants | Argentina | 99.9 /100 | #64 | Exceptional $49,627 |
| Bolivians | 99.9 /100 | #65 | Exceptional $49,526 |
| Immigrants | Bulgaria | 99.9 /100 | #66 | Exceptional $49,482 |
| Immigrants | Romania | 99.9 /100 | #67 | Exceptional $49,463 |
| Lithuanians | 99.8 /100 | #68 | Exceptional $49,448 |
| Immigrants | Canada | 99.8 /100 | #69 | Exceptional $49,412 |
| Immigrants | Eastern Europe | 99.8 /100 | #70 | Exceptional $49,316 |
| Greeks | 99.8 /100 | #71 | Exceptional $49,309 |
| Immigrants | Hungary | 99.8 /100 | #72 | Exceptional $49,303 |
| Immigrants | North America | 99.8 /100 | #73 | Exceptional $49,302 |
| Mongolians | 99.8 /100 | #74 | Exceptional $49,173 |
| Immigrants | Bolivia | 99.7 /100 | #75 | Exceptional $48,970 |