Danish vs Bermudan Per Capita Income
COMPARE
Danish
Bermudan
Per Capita Income
Per Capita Income Comparison
Danes
Bermudans
$44,095
PER CAPITA INCOME
61.9/ 100
METRIC RATING
160th/ 347
METRIC RANK
$42,911
PER CAPITA INCOME
30.1/ 100
METRIC RATING
189th/ 347
METRIC RANK
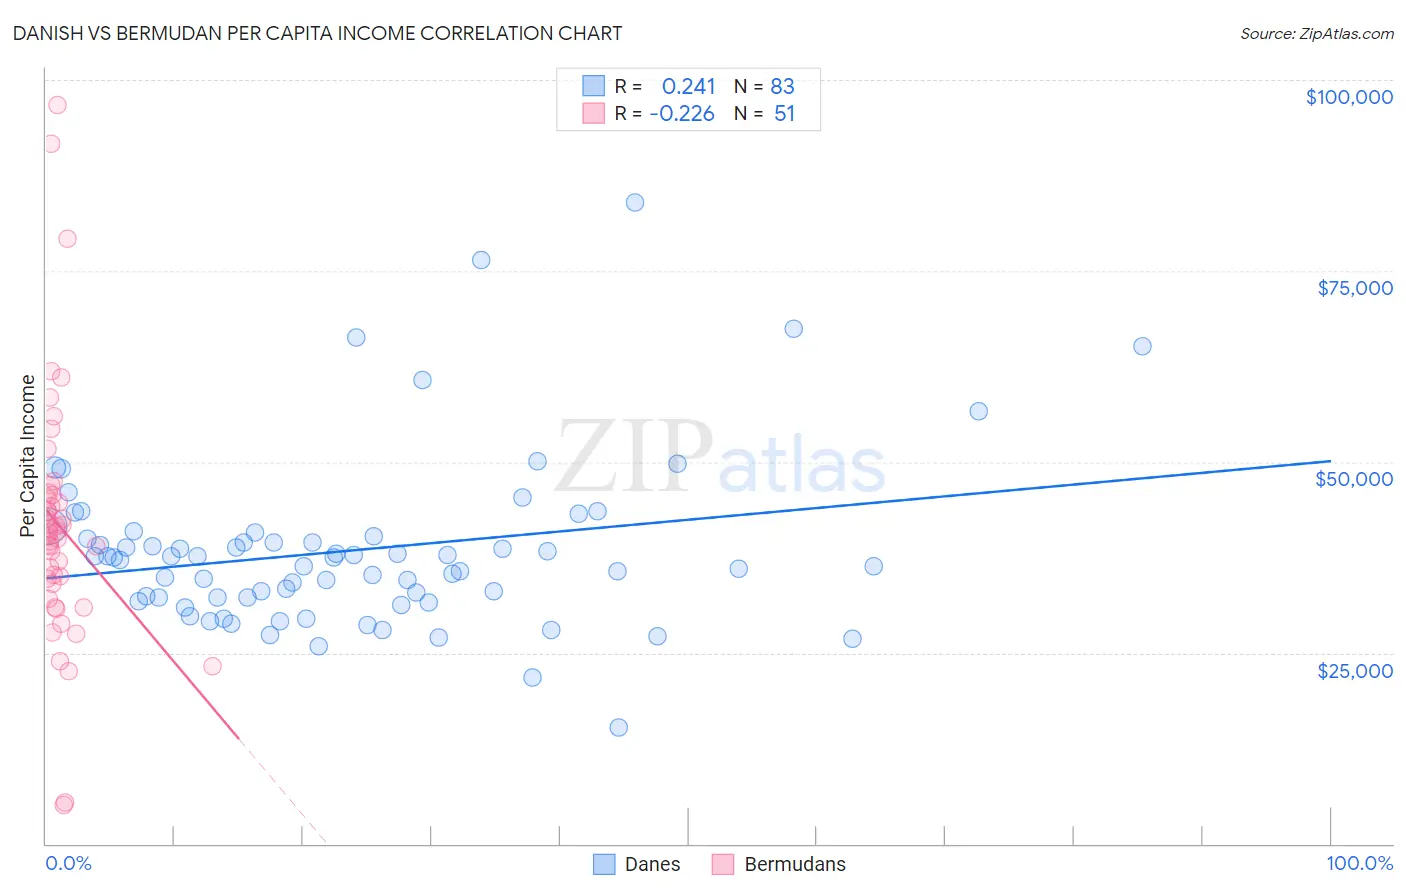
Danish vs Bermudan Per Capita Income Correlation Chart
The statistical analysis conducted on geographies consisting of 474,208,442 people shows a weak positive correlation between the proportion of Danes and per capita income in the United States with a correlation coefficient (R) of 0.241 and weighted average of $44,095. Similarly, the statistical analysis conducted on geographies consisting of 55,728,704 people shows a weak negative correlation between the proportion of Bermudans and per capita income in the United States with a correlation coefficient (R) of -0.226 and weighted average of $42,911, a difference of 2.8%.
Per Capita Income Correlation Summary
| Measurement | Danish | Bermudan |
| Minimum | $15,232 | $4,995 |
| Maximum | $83,892 | $96,710 |
| Range | $68,660 | $91,715 |
| Mean | $38,430 | $41,714 |
| Median | $37,481 | $40,756 |
| Interquartile 25% (IQ1) | $32,272 | $33,973 |
| Interquartile 75% (IQ3) | $40,294 | $45,741 |
| Interquartile Range (IQR) | $8,022 | $11,767 |
| Standard Deviation (Sample) | $11,196 | $16,477 |
| Standard Deviation (Population) | $11,128 | $16,314 |
Similar Demographics by Per Capita Income
Demographics Similar to Danes by Per Capita Income
In terms of per capita income, the demographic groups most similar to Danes are Costa Rican ($44,090, a difference of 0.010%), South American ($44,114, a difference of 0.040%), Swiss ($44,076, a difference of 0.040%), Immigrants from South America ($44,068, a difference of 0.060%), and Sri Lankan ($44,014, a difference of 0.18%).
| Demographics | Rating | Rank | Per Capita Income |
| Scottish | 70.6 /100 | #153 | Good $44,440 |
| Portuguese | 68.7 /100 | #154 | Good $44,362 |
| Uruguayans | 67.6 /100 | #155 | Good $44,318 |
| Slovaks | 65.4 /100 | #156 | Good $44,229 |
| South American Indians | 64.8 /100 | #157 | Good $44,206 |
| Immigrants | Nepal | 64.3 /100 | #158 | Good $44,187 |
| South Americans | 62.4 /100 | #159 | Good $44,114 |
| Danes | 61.9 /100 | #160 | Good $44,095 |
| Costa Ricans | 61.8 /100 | #161 | Good $44,090 |
| Swiss | 61.4 /100 | #162 | Good $44,076 |
| Immigrants | South America | 61.2 /100 | #163 | Good $44,068 |
| Sri Lankans | 59.8 /100 | #164 | Average $44,014 |
| Immigrants | Philippines | 59.4 /100 | #165 | Average $44,000 |
| Immigrants | Uruguay | 59.3 /100 | #166 | Average $43,997 |
| English | 58.9 /100 | #167 | Average $43,982 |
Demographics Similar to Bermudans by Per Capita Income
In terms of per capita income, the demographic groups most similar to Bermudans are Immigrants from Africa ($42,950, a difference of 0.090%), Immigrants from Colombia ($42,971, a difference of 0.14%), French Canadian ($43,003, a difference of 0.21%), Immigrants ($43,010, a difference of 0.23%), and Kenyan ($42,808, a difference of 0.24%).
| Demographics | Rating | Rank | Per Capita Income |
| Immigrants | Vietnam | 38.1 /100 | #182 | Fair $43,229 |
| Germans | 33.9 /100 | #183 | Fair $43,067 |
| Spaniards | 32.9 /100 | #184 | Fair $43,028 |
| Immigrants | Immigrants | 32.5 /100 | #185 | Fair $43,010 |
| French Canadians | 32.3 /100 | #186 | Fair $43,003 |
| Immigrants | Colombia | 31.5 /100 | #187 | Fair $42,971 |
| Immigrants | Africa | 31.0 /100 | #188 | Fair $42,950 |
| Bermudans | 30.1 /100 | #189 | Fair $42,911 |
| Kenyans | 27.7 /100 | #190 | Fair $42,808 |
| Yugoslavians | 27.4 /100 | #191 | Fair $42,792 |
| Iraqis | 26.7 /100 | #192 | Fair $42,760 |
| Immigrants | Sierra Leone | 26.5 /100 | #193 | Fair $42,752 |
| Immigrants | Fiji | 25.2 /100 | #194 | Fair $42,694 |
| Immigrants | Kenya | 24.5 /100 | #195 | Fair $42,661 |
| Dutch | 23.4 /100 | #196 | Fair $42,605 |