Danish vs Nepalese Per Capita Income
COMPARE
Danish
Nepalese
Per Capita Income
Per Capita Income Comparison
Danes
Nepalese
$44,095
PER CAPITA INCOME
61.9/ 100
METRIC RATING
160th/ 347
METRIC RANK
$38,442
PER CAPITA INCOME
0.3/ 100
METRIC RATING
273rd/ 347
METRIC RANK
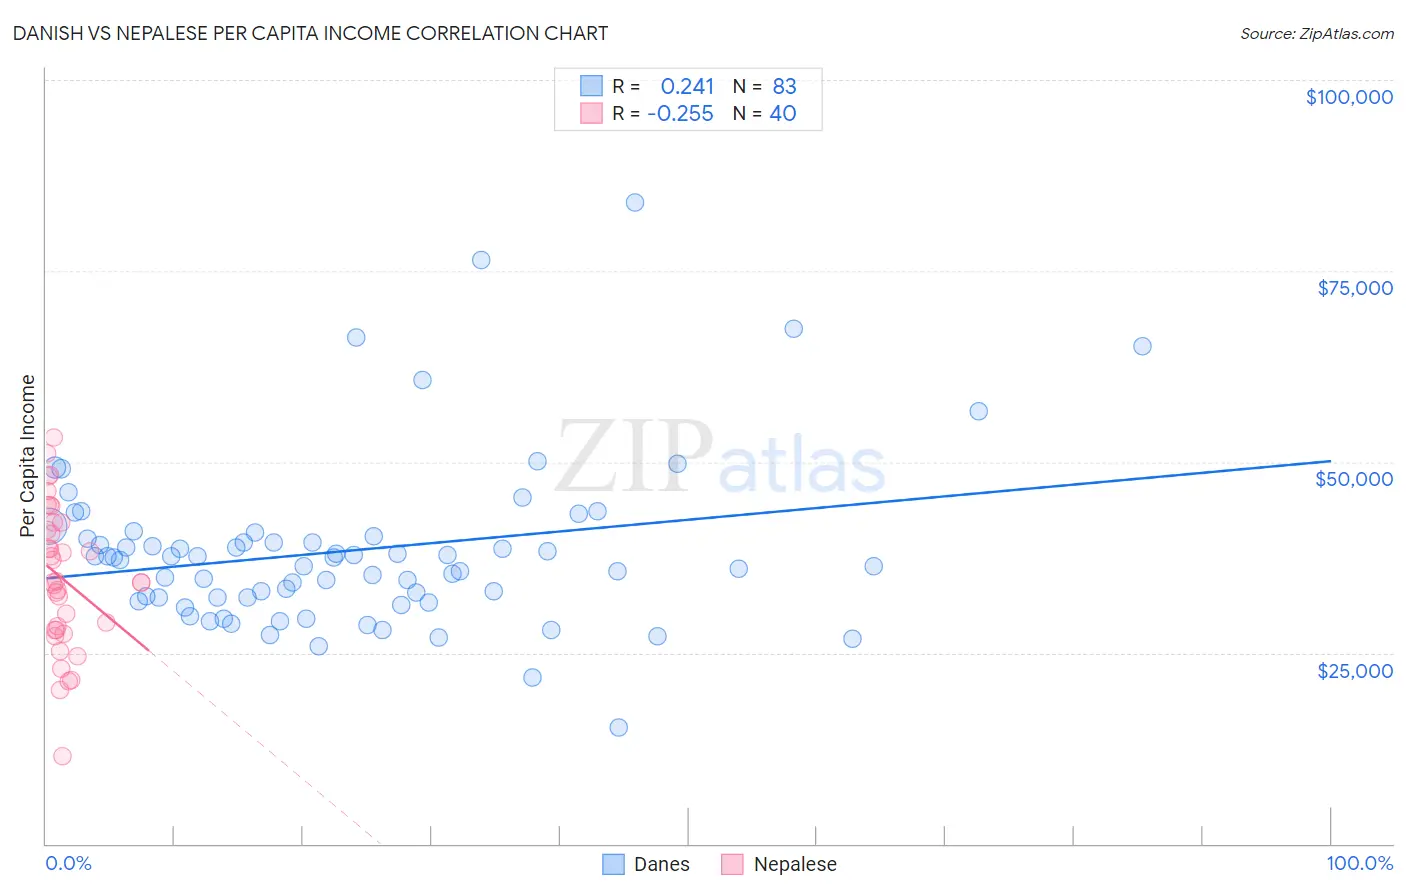
Danish vs Nepalese Per Capita Income Correlation Chart
The statistical analysis conducted on geographies consisting of 474,208,442 people shows a weak positive correlation between the proportion of Danes and per capita income in the United States with a correlation coefficient (R) of 0.241 and weighted average of $44,095. Similarly, the statistical analysis conducted on geographies consisting of 24,521,755 people shows a weak negative correlation between the proportion of Nepalese and per capita income in the United States with a correlation coefficient (R) of -0.255 and weighted average of $38,442, a difference of 14.7%.
Per Capita Income Correlation Summary
| Measurement | Danish | Nepalese |
| Minimum | $15,232 | $11,464 |
| Maximum | $83,892 | $53,263 |
| Range | $68,660 | $41,799 |
| Mean | $38,430 | $34,718 |
| Median | $37,481 | $34,262 |
| Interquartile 25% (IQ1) | $32,272 | $28,014 |
| Interquartile 75% (IQ3) | $40,294 | $41,612 |
| Interquartile Range (IQR) | $8,022 | $13,598 |
| Standard Deviation (Sample) | $11,196 | $9,316 |
| Standard Deviation (Population) | $11,128 | $9,199 |
Similar Demographics by Per Capita Income
Demographics Similar to Danes by Per Capita Income
In terms of per capita income, the demographic groups most similar to Danes are Costa Rican ($44,090, a difference of 0.010%), South American ($44,114, a difference of 0.040%), Swiss ($44,076, a difference of 0.040%), Immigrants from South America ($44,068, a difference of 0.060%), and Sri Lankan ($44,014, a difference of 0.18%).
| Demographics | Rating | Rank | Per Capita Income |
| Scottish | 70.6 /100 | #153 | Good $44,440 |
| Portuguese | 68.7 /100 | #154 | Good $44,362 |
| Uruguayans | 67.6 /100 | #155 | Good $44,318 |
| Slovaks | 65.4 /100 | #156 | Good $44,229 |
| South American Indians | 64.8 /100 | #157 | Good $44,206 |
| Immigrants | Nepal | 64.3 /100 | #158 | Good $44,187 |
| South Americans | 62.4 /100 | #159 | Good $44,114 |
| Danes | 61.9 /100 | #160 | Good $44,095 |
| Costa Ricans | 61.8 /100 | #161 | Good $44,090 |
| Swiss | 61.4 /100 | #162 | Good $44,076 |
| Immigrants | South America | 61.2 /100 | #163 | Good $44,068 |
| Sri Lankans | 59.8 /100 | #164 | Average $44,014 |
| Immigrants | Philippines | 59.4 /100 | #165 | Average $44,000 |
| Immigrants | Uruguay | 59.3 /100 | #166 | Average $43,997 |
| English | 58.9 /100 | #167 | Average $43,982 |
Demographics Similar to Nepalese by Per Capita Income
In terms of per capita income, the demographic groups most similar to Nepalese are Immigrants from El Salvador ($38,394, a difference of 0.13%), Immigrants from Cabo Verde ($38,540, a difference of 0.25%), Central American ($38,560, a difference of 0.31%), Immigrants from Belize ($38,614, a difference of 0.45%), and Immigrants from Liberia ($38,165, a difference of 0.73%).
| Demographics | Rating | Rank | Per Capita Income |
| Salvadorans | 0.5 /100 | #266 | Tragic $38,858 |
| Immigrants | Zaire | 0.4 /100 | #267 | Tragic $38,848 |
| Liberians | 0.4 /100 | #268 | Tragic $38,780 |
| Immigrants | Jamaica | 0.4 /100 | #269 | Tragic $38,766 |
| Immigrants | Belize | 0.3 /100 | #270 | Tragic $38,614 |
| Central Americans | 0.3 /100 | #271 | Tragic $38,560 |
| Immigrants | Cabo Verde | 0.3 /100 | #272 | Tragic $38,540 |
| Nepalese | 0.3 /100 | #273 | Tragic $38,442 |
| Immigrants | El Salvador | 0.3 /100 | #274 | Tragic $38,394 |
| Immigrants | Liberia | 0.2 /100 | #275 | Tragic $38,165 |
| Hmong | 0.2 /100 | #276 | Tragic $38,120 |
| Comanche | 0.2 /100 | #277 | Tragic $38,088 |
| Immigrants | Nicaragua | 0.2 /100 | #278 | Tragic $38,065 |
| Colville | 0.2 /100 | #279 | Tragic $38,047 |
| Potawatomi | 0.2 /100 | #280 | Tragic $38,046 |