Danish vs Immigrants from Hong Kong Per Capita Income
COMPARE
Danish
Immigrants from Hong Kong
Per Capita Income
Per Capita Income Comparison
Danes
Immigrants from Hong Kong
$44,095
PER CAPITA INCOME
61.9/ 100
METRIC RATING
160th/ 347
METRIC RANK
$56,709
PER CAPITA INCOME
100.0/ 100
METRIC RATING
8th/ 347
METRIC RANK
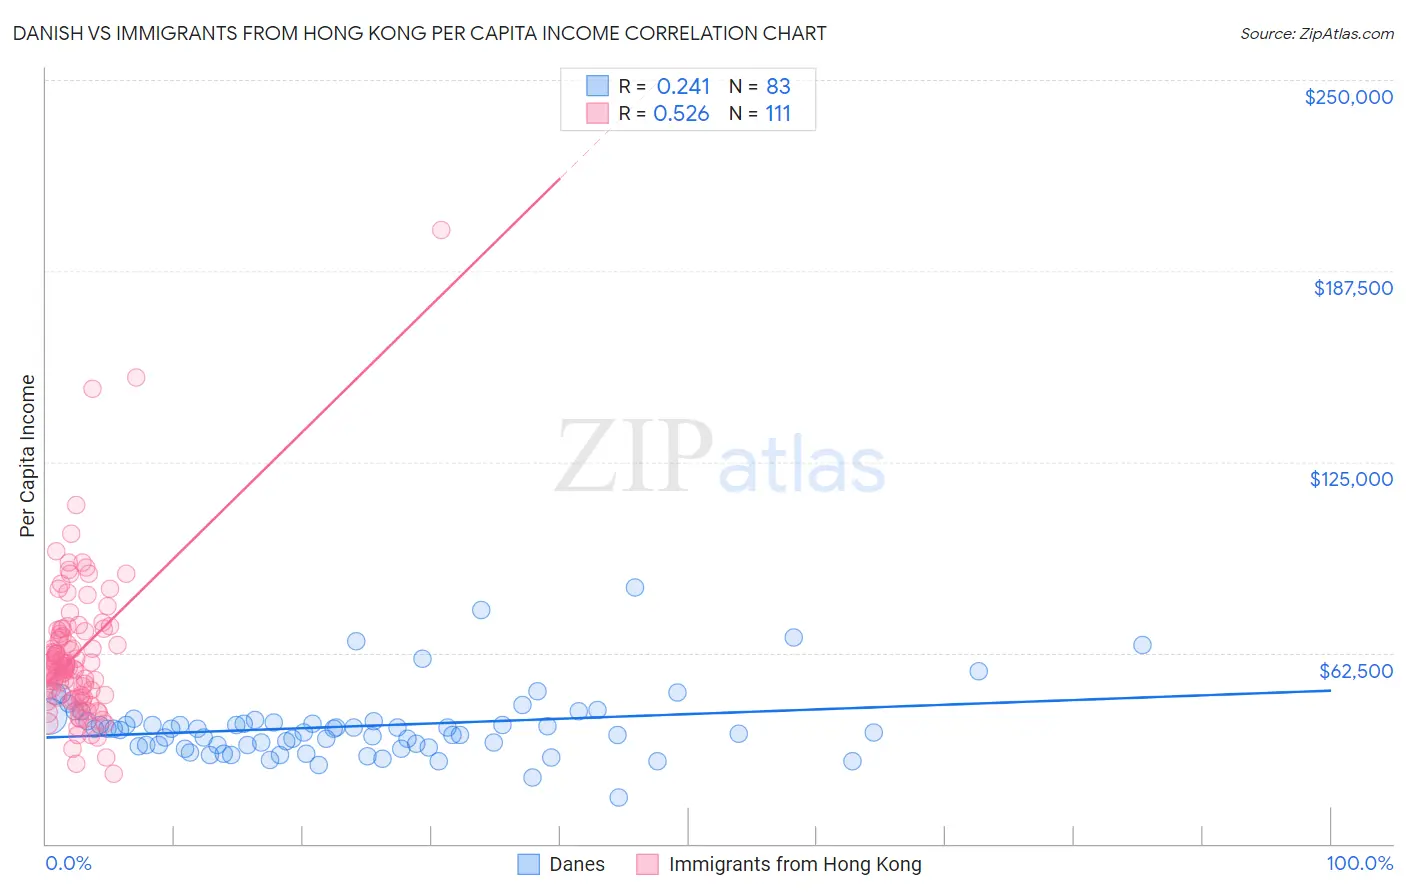
Danish vs Immigrants from Hong Kong Per Capita Income Correlation Chart
The statistical analysis conducted on geographies consisting of 474,208,442 people shows a weak positive correlation between the proportion of Danes and per capita income in the United States with a correlation coefficient (R) of 0.241 and weighted average of $44,095. Similarly, the statistical analysis conducted on geographies consisting of 253,979,312 people shows a substantial positive correlation between the proportion of Immigrants from Hong Kong and per capita income in the United States with a correlation coefficient (R) of 0.526 and weighted average of $56,709, a difference of 28.6%.
Per Capita Income Correlation Summary
| Measurement | Danish | Immigrants from Hong Kong |
| Minimum | $15,232 | $23,001 |
| Maximum | $83,892 | $200,879 |
| Range | $68,660 | $177,878 |
| Mean | $38,430 | $62,312 |
| Median | $37,481 | $57,767 |
| Interquartile 25% (IQ1) | $32,272 | $47,777 |
| Interquartile 75% (IQ3) | $40,294 | $69,849 |
| Interquartile Range (IQR) | $8,022 | $22,072 |
| Standard Deviation (Sample) | $11,196 | $24,374 |
| Standard Deviation (Population) | $11,128 | $24,264 |
Similar Demographics by Per Capita Income
Demographics Similar to Danes by Per Capita Income
In terms of per capita income, the demographic groups most similar to Danes are Costa Rican ($44,090, a difference of 0.010%), South American ($44,114, a difference of 0.040%), Swiss ($44,076, a difference of 0.040%), Immigrants from South America ($44,068, a difference of 0.060%), and Sri Lankan ($44,014, a difference of 0.18%).
| Demographics | Rating | Rank | Per Capita Income |
| Scottish | 70.6 /100 | #153 | Good $44,440 |
| Portuguese | 68.7 /100 | #154 | Good $44,362 |
| Uruguayans | 67.6 /100 | #155 | Good $44,318 |
| Slovaks | 65.4 /100 | #156 | Good $44,229 |
| South American Indians | 64.8 /100 | #157 | Good $44,206 |
| Immigrants | Nepal | 64.3 /100 | #158 | Good $44,187 |
| South Americans | 62.4 /100 | #159 | Good $44,114 |
| Danes | 61.9 /100 | #160 | Good $44,095 |
| Costa Ricans | 61.8 /100 | #161 | Good $44,090 |
| Swiss | 61.4 /100 | #162 | Good $44,076 |
| Immigrants | South America | 61.2 /100 | #163 | Good $44,068 |
| Sri Lankans | 59.8 /100 | #164 | Average $44,014 |
| Immigrants | Philippines | 59.4 /100 | #165 | Average $44,000 |
| Immigrants | Uruguay | 59.3 /100 | #166 | Average $43,997 |
| English | 58.9 /100 | #167 | Average $43,982 |
Demographics Similar to Immigrants from Hong Kong by Per Capita Income
In terms of per capita income, the demographic groups most similar to Immigrants from Hong Kong are Immigrants from Ireland ($56,584, a difference of 0.22%), Immigrants from Israel ($57,384, a difference of 1.2%), Okinawan ($55,817, a difference of 1.6%), Eastern European ($55,780, a difference of 1.7%), and Immigrants from Taiwan ($57,742, a difference of 1.8%).
| Demographics | Rating | Rank | Per Capita Income |
| Filipinos | 100.0 /100 | #1 | Exceptional $59,066 |
| Iranians | 100.0 /100 | #2 | Exceptional $58,786 |
| Immigrants | Singapore | 100.0 /100 | #3 | Exceptional $58,353 |
| Immigrants | Australia | 100.0 /100 | #4 | Exceptional $57,953 |
| Immigrants | Iran | 100.0 /100 | #5 | Exceptional $57,759 |
| Immigrants | Taiwan | 100.0 /100 | #6 | Exceptional $57,742 |
| Immigrants | Israel | 100.0 /100 | #7 | Exceptional $57,384 |
| Immigrants | Hong Kong | 100.0 /100 | #8 | Exceptional $56,709 |
| Immigrants | Ireland | 100.0 /100 | #9 | Exceptional $56,584 |
| Okinawans | 100.0 /100 | #10 | Exceptional $55,817 |
| Eastern Europeans | 100.0 /100 | #11 | Exceptional $55,780 |
| Immigrants | Sweden | 100.0 /100 | #12 | Exceptional $55,582 |
| Immigrants | India | 100.0 /100 | #13 | Exceptional $55,268 |
| Immigrants | Belgium | 100.0 /100 | #14 | Exceptional $55,082 |
| Cypriots | 100.0 /100 | #15 | Exceptional $54,899 |