Danish vs Barbadian Per Capita Income
COMPARE
Danish
Barbadian
Per Capita Income
Per Capita Income Comparison
Danes
Barbadians
$44,095
PER CAPITA INCOME
61.9/ 100
METRIC RATING
160th/ 347
METRIC RANK
$42,406
PER CAPITA INCOME
19.6/ 100
METRIC RATING
199th/ 347
METRIC RANK
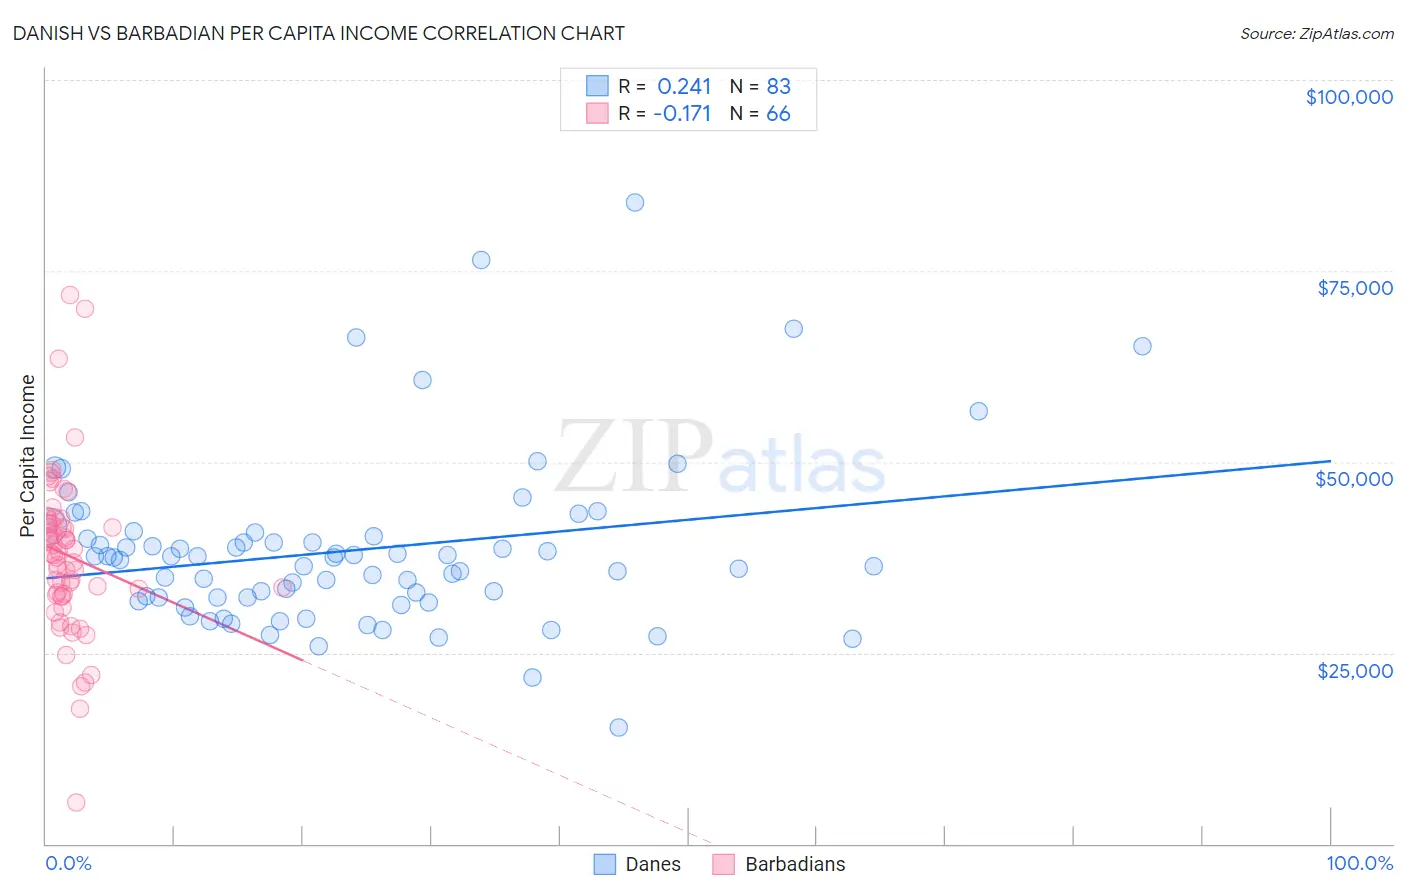
Danish vs Barbadian Per Capita Income Correlation Chart
The statistical analysis conducted on geographies consisting of 474,208,442 people shows a weak positive correlation between the proportion of Danes and per capita income in the United States with a correlation coefficient (R) of 0.241 and weighted average of $44,095. Similarly, the statistical analysis conducted on geographies consisting of 141,304,082 people shows a poor negative correlation between the proportion of Barbadians and per capita income in the United States with a correlation coefficient (R) of -0.171 and weighted average of $42,406, a difference of 4.0%.
Per Capita Income Correlation Summary
| Measurement | Danish | Barbadian |
| Minimum | $15,232 | $5,324 |
| Maximum | $83,892 | $71,926 |
| Range | $68,660 | $66,602 |
| Mean | $38,430 | $37,719 |
| Median | $37,481 | $37,906 |
| Interquartile 25% (IQ1) | $32,272 | $32,556 |
| Interquartile 75% (IQ3) | $40,294 | $41,973 |
| Interquartile Range (IQR) | $8,022 | $9,418 |
| Standard Deviation (Sample) | $11,196 | $10,673 |
| Standard Deviation (Population) | $11,128 | $10,592 |
Similar Demographics by Per Capita Income
Demographics Similar to Danes by Per Capita Income
In terms of per capita income, the demographic groups most similar to Danes are Costa Rican ($44,090, a difference of 0.010%), South American ($44,114, a difference of 0.040%), Swiss ($44,076, a difference of 0.040%), Immigrants from South America ($44,068, a difference of 0.060%), and Sri Lankan ($44,014, a difference of 0.18%).
| Demographics | Rating | Rank | Per Capita Income |
| Scottish | 70.6 /100 | #153 | Good $44,440 |
| Portuguese | 68.7 /100 | #154 | Good $44,362 |
| Uruguayans | 67.6 /100 | #155 | Good $44,318 |
| Slovaks | 65.4 /100 | #156 | Good $44,229 |
| South American Indians | 64.8 /100 | #157 | Good $44,206 |
| Immigrants | Nepal | 64.3 /100 | #158 | Good $44,187 |
| South Americans | 62.4 /100 | #159 | Good $44,114 |
| Danes | 61.9 /100 | #160 | Good $44,095 |
| Costa Ricans | 61.8 /100 | #161 | Good $44,090 |
| Swiss | 61.4 /100 | #162 | Good $44,076 |
| Immigrants | South America | 61.2 /100 | #163 | Good $44,068 |
| Sri Lankans | 59.8 /100 | #164 | Average $44,014 |
| Immigrants | Philippines | 59.4 /100 | #165 | Average $44,000 |
| Immigrants | Uruguay | 59.3 /100 | #166 | Average $43,997 |
| English | 58.9 /100 | #167 | Average $43,982 |
Demographics Similar to Barbadians by Per Capita Income
In terms of per capita income, the demographic groups most similar to Barbadians are Immigrants from Portugal ($42,412, a difference of 0.010%), Vietnamese ($42,368, a difference of 0.090%), Immigrants from Thailand ($42,289, a difference of 0.28%), Immigrants from Bosnia and Herzegovina ($42,278, a difference of 0.30%), and Scotch-Irish ($42,563, a difference of 0.37%).
| Demographics | Rating | Rank | Per Capita Income |
| Iraqis | 26.7 /100 | #192 | Fair $42,760 |
| Immigrants | Sierra Leone | 26.5 /100 | #193 | Fair $42,752 |
| Immigrants | Fiji | 25.2 /100 | #194 | Fair $42,694 |
| Immigrants | Kenya | 24.5 /100 | #195 | Fair $42,661 |
| Dutch | 23.4 /100 | #196 | Fair $42,605 |
| Scotch-Irish | 22.6 /100 | #197 | Fair $42,563 |
| Immigrants | Portugal | 19.7 /100 | #198 | Poor $42,412 |
| Barbadians | 19.6 /100 | #199 | Poor $42,406 |
| Vietnamese | 19.0 /100 | #200 | Poor $42,368 |
| Immigrants | Thailand | 17.6 /100 | #201 | Poor $42,289 |
| Immigrants | Bosnia and Herzegovina | 17.5 /100 | #202 | Poor $42,278 |
| Spanish | 17.0 /100 | #203 | Poor $42,249 |
| Aleuts | 16.4 /100 | #204 | Poor $42,210 |
| Whites/Caucasians | 15.9 /100 | #205 | Poor $42,180 |
| Ghanaians | 15.7 /100 | #206 | Poor $42,164 |