Danish vs Immigrants from Morocco Per Capita Income
COMPARE
Danish
Immigrants from Morocco
Per Capita Income
Per Capita Income Comparison
Danes
Immigrants from Morocco
$44,095
PER CAPITA INCOME
61.9/ 100
METRIC RATING
160th/ 347
METRIC RANK
$46,430
PER CAPITA INCOME
95.7/ 100
METRIC RATING
112th/ 347
METRIC RANK
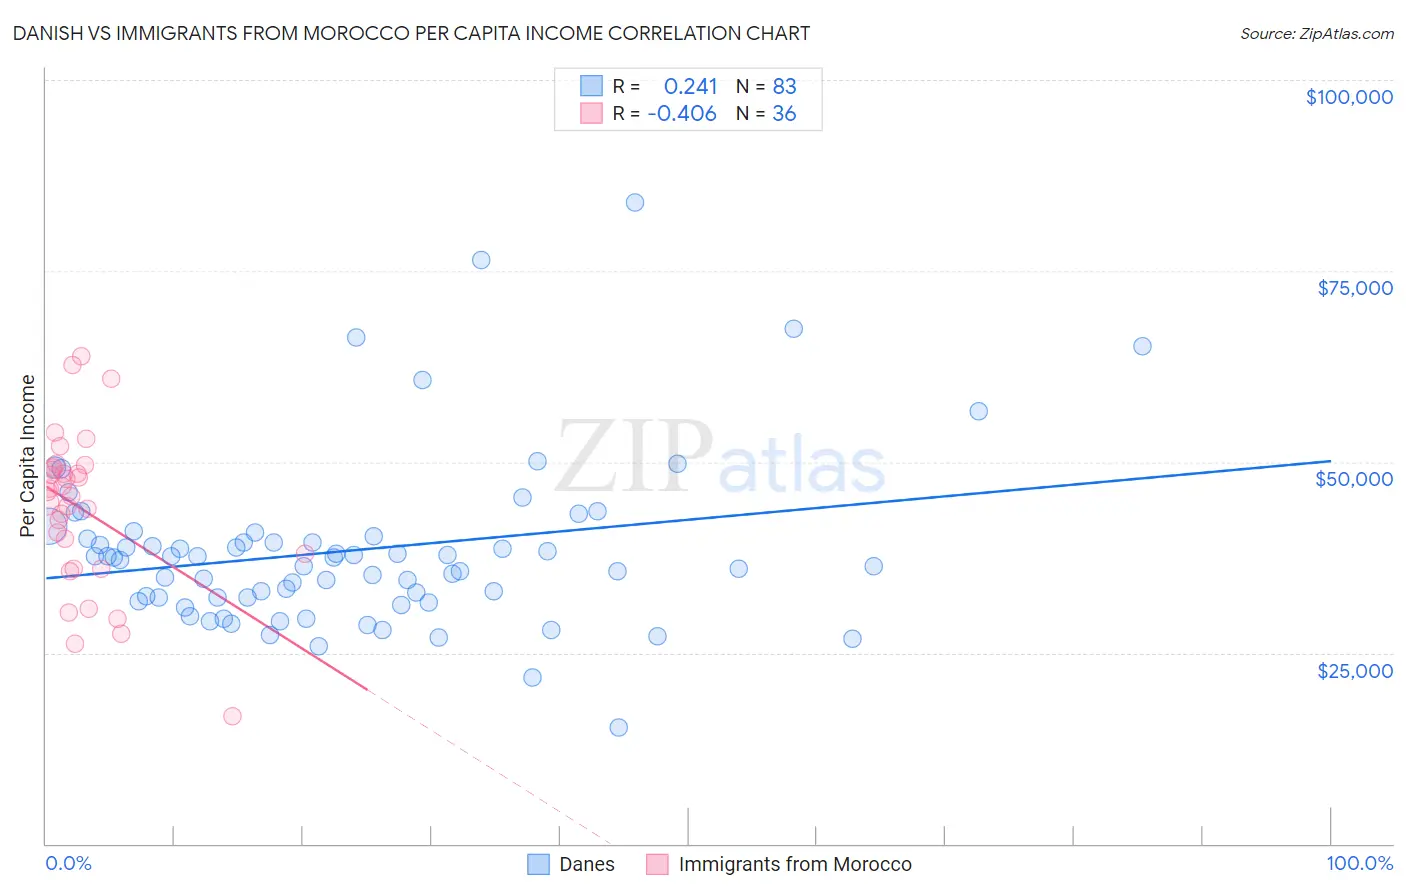
Danish vs Immigrants from Morocco Per Capita Income Correlation Chart
The statistical analysis conducted on geographies consisting of 474,208,442 people shows a weak positive correlation between the proportion of Danes and per capita income in the United States with a correlation coefficient (R) of 0.241 and weighted average of $44,095. Similarly, the statistical analysis conducted on geographies consisting of 178,911,890 people shows a moderate negative correlation between the proportion of Immigrants from Morocco and per capita income in the United States with a correlation coefficient (R) of -0.406 and weighted average of $46,430, a difference of 5.3%.
Per Capita Income Correlation Summary
| Measurement | Danish | Immigrants from Morocco |
| Minimum | $15,232 | $16,654 |
| Maximum | $83,892 | $63,792 |
| Range | $68,660 | $47,138 |
| Mean | $38,430 | $43,757 |
| Median | $37,481 | $45,863 |
| Interquartile 25% (IQ1) | $32,272 | $36,958 |
| Interquartile 75% (IQ3) | $40,294 | $49,075 |
| Interquartile Range (IQR) | $8,022 | $12,117 |
| Standard Deviation (Sample) | $11,196 | $10,240 |
| Standard Deviation (Population) | $11,128 | $10,097 |
Similar Demographics by Per Capita Income
Demographics Similar to Danes by Per Capita Income
In terms of per capita income, the demographic groups most similar to Danes are Costa Rican ($44,090, a difference of 0.010%), South American ($44,114, a difference of 0.040%), Swiss ($44,076, a difference of 0.040%), Immigrants from South America ($44,068, a difference of 0.060%), and Sri Lankan ($44,014, a difference of 0.18%).
| Demographics | Rating | Rank | Per Capita Income |
| Scottish | 70.6 /100 | #153 | Good $44,440 |
| Portuguese | 68.7 /100 | #154 | Good $44,362 |
| Uruguayans | 67.6 /100 | #155 | Good $44,318 |
| Slovaks | 65.4 /100 | #156 | Good $44,229 |
| South American Indians | 64.8 /100 | #157 | Good $44,206 |
| Immigrants | Nepal | 64.3 /100 | #158 | Good $44,187 |
| South Americans | 62.4 /100 | #159 | Good $44,114 |
| Danes | 61.9 /100 | #160 | Good $44,095 |
| Costa Ricans | 61.8 /100 | #161 | Good $44,090 |
| Swiss | 61.4 /100 | #162 | Good $44,076 |
| Immigrants | South America | 61.2 /100 | #163 | Good $44,068 |
| Sri Lankans | 59.8 /100 | #164 | Average $44,014 |
| Immigrants | Philippines | 59.4 /100 | #165 | Average $44,000 |
| Immigrants | Uruguay | 59.3 /100 | #166 | Average $43,997 |
| English | 58.9 /100 | #167 | Average $43,982 |
Demographics Similar to Immigrants from Morocco by Per Capita Income
In terms of per capita income, the demographic groups most similar to Immigrants from Morocco are Taiwanese ($46,455, a difference of 0.050%), Chilean ($46,459, a difference of 0.060%), Immigrants from Albania ($46,387, a difference of 0.090%), Immigrants from Northern Africa ($46,531, a difference of 0.22%), and Immigrants from Kuwait ($46,543, a difference of 0.24%).
| Demographics | Rating | Rank | Per Capita Income |
| British | 96.3 /100 | #105 | Exceptional $46,571 |
| Ethiopians | 96.3 /100 | #106 | Exceptional $46,569 |
| Serbians | 96.2 /100 | #107 | Exceptional $46,551 |
| Immigrants | Kuwait | 96.2 /100 | #108 | Exceptional $46,543 |
| Immigrants | Northern Africa | 96.2 /100 | #109 | Exceptional $46,531 |
| Chileans | 95.9 /100 | #110 | Exceptional $46,459 |
| Taiwanese | 95.8 /100 | #111 | Exceptional $46,455 |
| Immigrants | Morocco | 95.7 /100 | #112 | Exceptional $46,430 |
| Immigrants | Albania | 95.5 /100 | #113 | Exceptional $46,387 |
| Afghans | 94.9 /100 | #114 | Exceptional $46,268 |
| Immigrants | Chile | 94.6 /100 | #115 | Exceptional $46,213 |
| Poles | 94.1 /100 | #116 | Exceptional $46,123 |
| Chinese | 93.9 /100 | #117 | Exceptional $46,098 |
| Immigrants | Saudi Arabia | 93.3 /100 | #118 | Exceptional $46,008 |
| Immigrants | Poland | 93.1 /100 | #119 | Exceptional $45,979 |