Danish vs Ottawa Per Capita Income
COMPARE
Danish
Ottawa
Per Capita Income
Per Capita Income Comparison
Danes
Ottawa
$44,095
PER CAPITA INCOME
61.9/ 100
METRIC RATING
160th/ 347
METRIC RANK
$37,101
PER CAPITA INCOME
0.1/ 100
METRIC RATING
301st/ 347
METRIC RANK
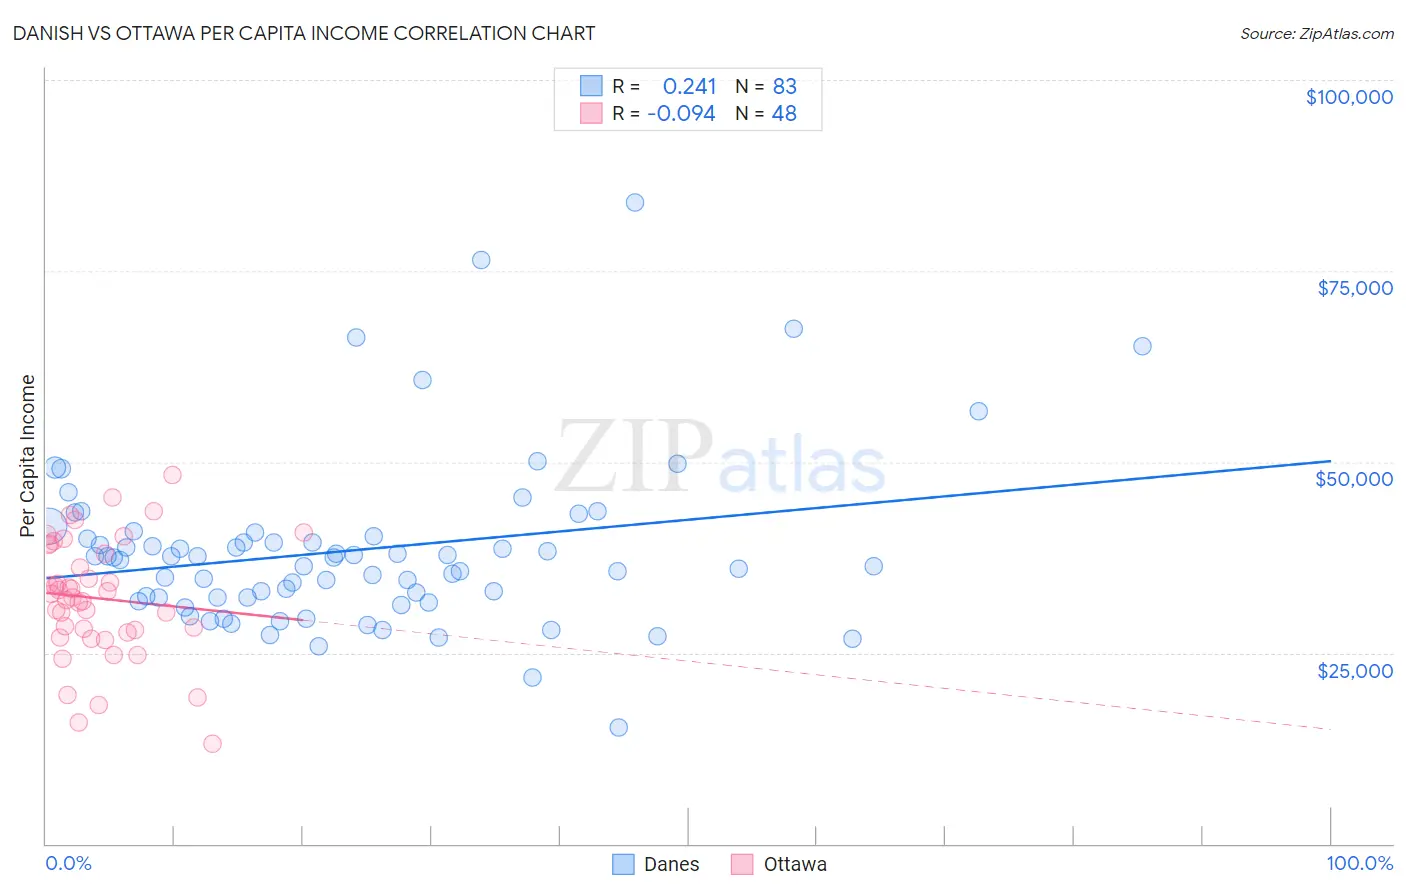
Danish vs Ottawa Per Capita Income Correlation Chart
The statistical analysis conducted on geographies consisting of 474,208,442 people shows a weak positive correlation between the proportion of Danes and per capita income in the United States with a correlation coefficient (R) of 0.241 and weighted average of $44,095. Similarly, the statistical analysis conducted on geographies consisting of 49,956,726 people shows a slight negative correlation between the proportion of Ottawa and per capita income in the United States with a correlation coefficient (R) of -0.094 and weighted average of $37,101, a difference of 18.9%.
Per Capita Income Correlation Summary
| Measurement | Danish | Ottawa |
| Minimum | $15,232 | $13,161 |
| Maximum | $83,892 | $48,274 |
| Range | $68,660 | $35,113 |
| Mean | $38,430 | $32,137 |
| Median | $37,481 | $32,448 |
| Interquartile 25% (IQ1) | $32,272 | $27,814 |
| Interquartile 75% (IQ3) | $40,294 | $38,554 |
| Interquartile Range (IQR) | $8,022 | $10,740 |
| Standard Deviation (Sample) | $11,196 | $7,713 |
| Standard Deviation (Population) | $11,128 | $7,632 |
Similar Demographics by Per Capita Income
Demographics Similar to Danes by Per Capita Income
In terms of per capita income, the demographic groups most similar to Danes are Costa Rican ($44,090, a difference of 0.010%), South American ($44,114, a difference of 0.040%), Swiss ($44,076, a difference of 0.040%), Immigrants from South America ($44,068, a difference of 0.060%), and Sri Lankan ($44,014, a difference of 0.18%).
| Demographics | Rating | Rank | Per Capita Income |
| Scottish | 70.6 /100 | #153 | Good $44,440 |
| Portuguese | 68.7 /100 | #154 | Good $44,362 |
| Uruguayans | 67.6 /100 | #155 | Good $44,318 |
| Slovaks | 65.4 /100 | #156 | Good $44,229 |
| South American Indians | 64.8 /100 | #157 | Good $44,206 |
| Immigrants | Nepal | 64.3 /100 | #158 | Good $44,187 |
| South Americans | 62.4 /100 | #159 | Good $44,114 |
| Danes | 61.9 /100 | #160 | Good $44,095 |
| Costa Ricans | 61.8 /100 | #161 | Good $44,090 |
| Swiss | 61.4 /100 | #162 | Good $44,076 |
| Immigrants | South America | 61.2 /100 | #163 | Good $44,068 |
| Sri Lankans | 59.8 /100 | #164 | Average $44,014 |
| Immigrants | Philippines | 59.4 /100 | #165 | Average $44,000 |
| Immigrants | Uruguay | 59.3 /100 | #166 | Average $43,997 |
| English | 58.9 /100 | #167 | Average $43,982 |
Demographics Similar to Ottawa by Per Capita Income
In terms of per capita income, the demographic groups most similar to Ottawa are Shoshone ($37,072, a difference of 0.080%), Paiute ($37,066, a difference of 0.10%), Honduran ($37,031, a difference of 0.19%), Immigrants from Bahamas ($37,193, a difference of 0.25%), and Cherokee ($37,203, a difference of 0.27%).
| Demographics | Rating | Rank | Per Capita Income |
| Cubans | 0.1 /100 | #294 | Tragic $37,383 |
| Immigrants | Dominican Republic | 0.1 /100 | #295 | Tragic $37,306 |
| Indonesians | 0.1 /100 | #296 | Tragic $37,300 |
| Haitians | 0.1 /100 | #297 | Tragic $37,289 |
| Immigrants | Caribbean | 0.1 /100 | #298 | Tragic $37,254 |
| Cherokee | 0.1 /100 | #299 | Tragic $37,203 |
| Immigrants | Bahamas | 0.1 /100 | #300 | Tragic $37,193 |
| Ottawa | 0.1 /100 | #301 | Tragic $37,101 |
| Shoshone | 0.1 /100 | #302 | Tragic $37,072 |
| Paiute | 0.1 /100 | #303 | Tragic $37,066 |
| Hondurans | 0.1 /100 | #304 | Tragic $37,031 |
| Inupiat | 0.1 /100 | #305 | Tragic $36,999 |
| Immigrants | Haiti | 0.0 /100 | #306 | Tragic $36,849 |
| Immigrants | Latin America | 0.0 /100 | #307 | Tragic $36,823 |
| Fijians | 0.0 /100 | #308 | Tragic $36,690 |