Danish vs Immigrants from Singapore Per Capita Income
COMPARE
Danish
Immigrants from Singapore
Per Capita Income
Per Capita Income Comparison
Danes
Immigrants from Singapore
$44,095
PER CAPITA INCOME
61.9/ 100
METRIC RATING
160th/ 347
METRIC RANK
$58,353
PER CAPITA INCOME
100.0/ 100
METRIC RATING
3rd/ 347
METRIC RANK
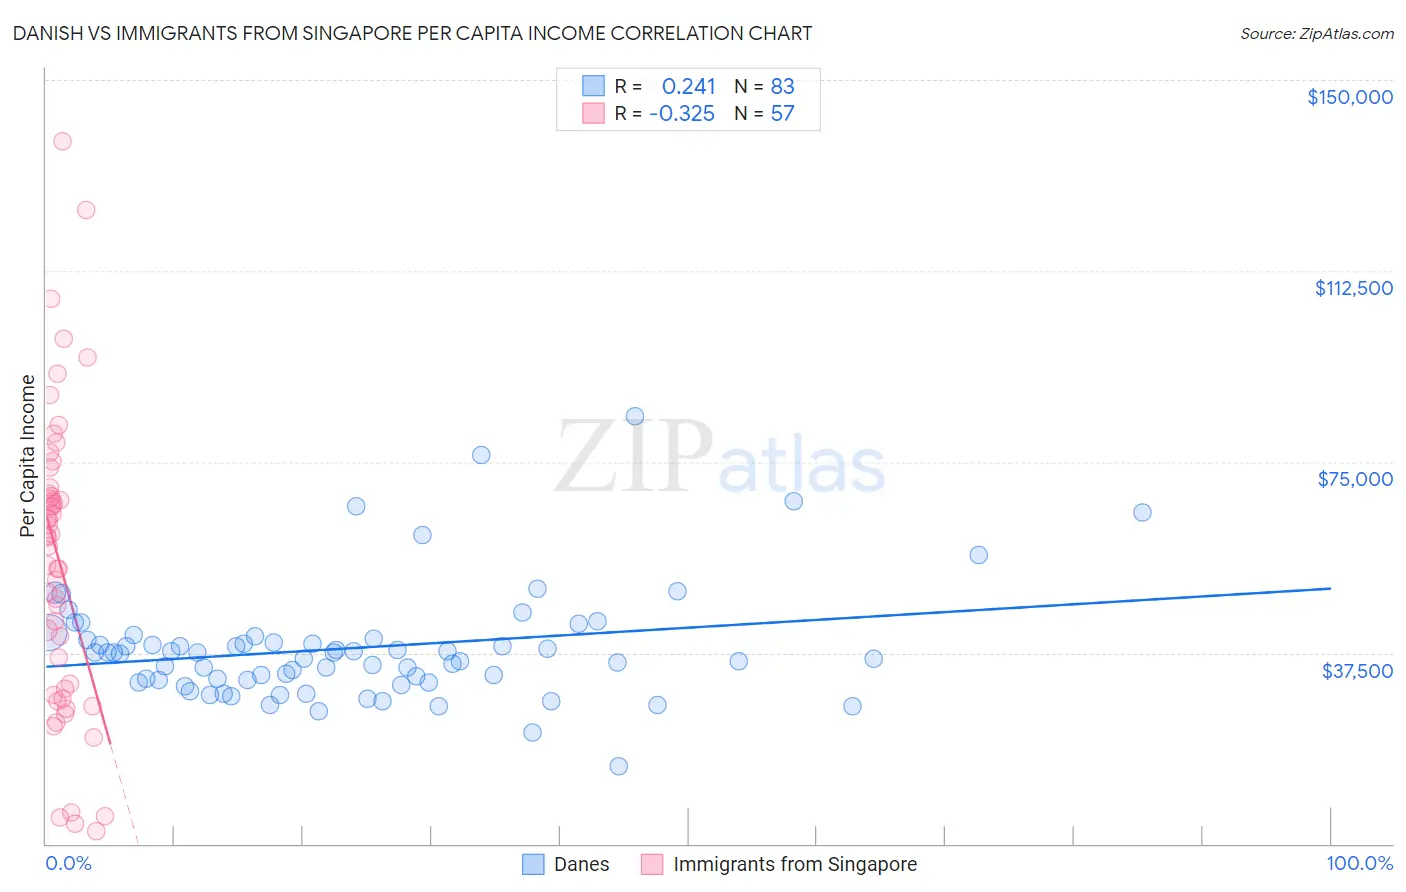
Danish vs Immigrants from Singapore Per Capita Income Correlation Chart
The statistical analysis conducted on geographies consisting of 474,208,442 people shows a weak positive correlation between the proportion of Danes and per capita income in the United States with a correlation coefficient (R) of 0.241 and weighted average of $44,095. Similarly, the statistical analysis conducted on geographies consisting of 137,503,143 people shows a mild negative correlation between the proportion of Immigrants from Singapore and per capita income in the United States with a correlation coefficient (R) of -0.325 and weighted average of $58,353, a difference of 32.3%.
Per Capita Income Correlation Summary
| Measurement | Danish | Immigrants from Singapore |
| Minimum | $15,232 | $2,563 |
| Maximum | $83,892 | $138,022 |
| Range | $68,660 | $135,459 |
| Mean | $38,430 | $55,363 |
| Median | $37,481 | $60,089 |
| Interquartile 25% (IQ1) | $32,272 | $29,825 |
| Interquartile 75% (IQ3) | $40,294 | $69,357 |
| Interquartile Range (IQR) | $8,022 | $39,532 |
| Standard Deviation (Sample) | $11,196 | $29,306 |
| Standard Deviation (Population) | $11,128 | $29,048 |
Similar Demographics by Per Capita Income
Demographics Similar to Danes by Per Capita Income
In terms of per capita income, the demographic groups most similar to Danes are Costa Rican ($44,090, a difference of 0.010%), South American ($44,114, a difference of 0.040%), Swiss ($44,076, a difference of 0.040%), Immigrants from South America ($44,068, a difference of 0.060%), and Sri Lankan ($44,014, a difference of 0.18%).
| Demographics | Rating | Rank | Per Capita Income |
| Scottish | 70.6 /100 | #153 | Good $44,440 |
| Portuguese | 68.7 /100 | #154 | Good $44,362 |
| Uruguayans | 67.6 /100 | #155 | Good $44,318 |
| Slovaks | 65.4 /100 | #156 | Good $44,229 |
| South American Indians | 64.8 /100 | #157 | Good $44,206 |
| Immigrants | Nepal | 64.3 /100 | #158 | Good $44,187 |
| South Americans | 62.4 /100 | #159 | Good $44,114 |
| Danes | 61.9 /100 | #160 | Good $44,095 |
| Costa Ricans | 61.8 /100 | #161 | Good $44,090 |
| Swiss | 61.4 /100 | #162 | Good $44,076 |
| Immigrants | South America | 61.2 /100 | #163 | Good $44,068 |
| Sri Lankans | 59.8 /100 | #164 | Average $44,014 |
| Immigrants | Philippines | 59.4 /100 | #165 | Average $44,000 |
| Immigrants | Uruguay | 59.3 /100 | #166 | Average $43,997 |
| English | 58.9 /100 | #167 | Average $43,982 |
Demographics Similar to Immigrants from Singapore by Per Capita Income
In terms of per capita income, the demographic groups most similar to Immigrants from Singapore are Immigrants from Australia ($57,953, a difference of 0.69%), Iranian ($58,786, a difference of 0.74%), Immigrants from Iran ($57,759, a difference of 1.0%), Immigrants from Taiwan ($57,742, a difference of 1.1%), and Filipino ($59,066, a difference of 1.2%).
| Demographics | Rating | Rank | Per Capita Income |
| Filipinos | 100.0 /100 | #1 | Exceptional $59,066 |
| Iranians | 100.0 /100 | #2 | Exceptional $58,786 |
| Immigrants | Singapore | 100.0 /100 | #3 | Exceptional $58,353 |
| Immigrants | Australia | 100.0 /100 | #4 | Exceptional $57,953 |
| Immigrants | Iran | 100.0 /100 | #5 | Exceptional $57,759 |
| Immigrants | Taiwan | 100.0 /100 | #6 | Exceptional $57,742 |
| Immigrants | Israel | 100.0 /100 | #7 | Exceptional $57,384 |
| Immigrants | Hong Kong | 100.0 /100 | #8 | Exceptional $56,709 |
| Immigrants | Ireland | 100.0 /100 | #9 | Exceptional $56,584 |
| Okinawans | 100.0 /100 | #10 | Exceptional $55,817 |
| Eastern Europeans | 100.0 /100 | #11 | Exceptional $55,780 |
| Immigrants | Sweden | 100.0 /100 | #12 | Exceptional $55,582 |
| Immigrants | India | 100.0 /100 | #13 | Exceptional $55,268 |
| Immigrants | Belgium | 100.0 /100 | #14 | Exceptional $55,082 |
| Cypriots | 100.0 /100 | #15 | Exceptional $54,899 |