Danish vs Immigrants from Croatia Per Capita Income
COMPARE
Danish
Immigrants from Croatia
Per Capita Income
Per Capita Income Comparison
Danes
Immigrants from Croatia
$44,095
PER CAPITA INCOME
61.9/ 100
METRIC RATING
160th/ 347
METRIC RANK
$50,417
PER CAPITA INCOME
99.9/ 100
METRIC RATING
52nd/ 347
METRIC RANK
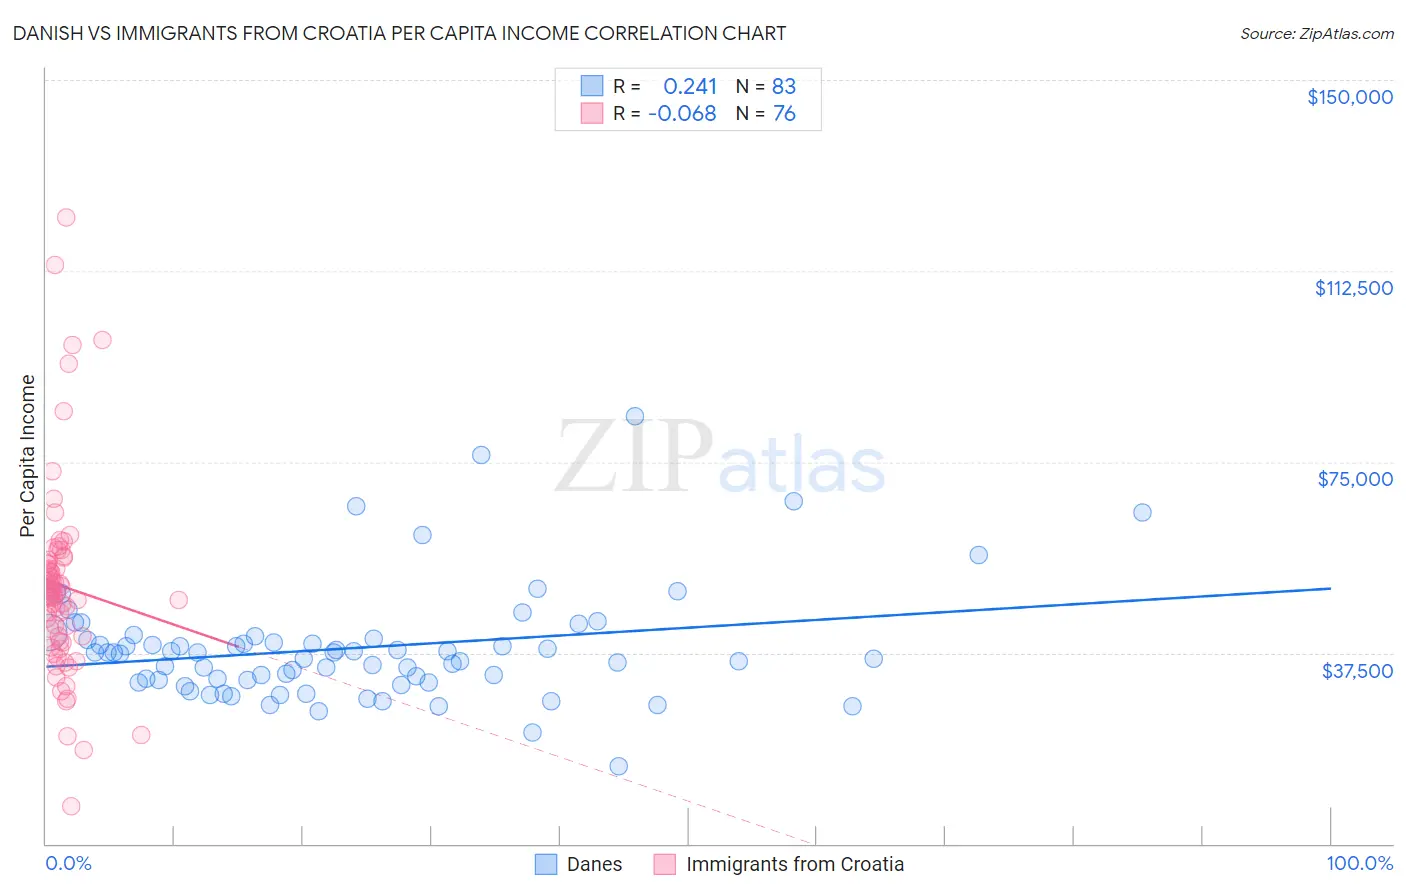
Danish vs Immigrants from Croatia Per Capita Income Correlation Chart
The statistical analysis conducted on geographies consisting of 474,208,442 people shows a weak positive correlation between the proportion of Danes and per capita income in the United States with a correlation coefficient (R) of 0.241 and weighted average of $44,095. Similarly, the statistical analysis conducted on geographies consisting of 132,568,979 people shows a slight negative correlation between the proportion of Immigrants from Croatia and per capita income in the United States with a correlation coefficient (R) of -0.068 and weighted average of $50,417, a difference of 14.3%.
Per Capita Income Correlation Summary
| Measurement | Danish | Immigrants from Croatia |
| Minimum | $15,232 | $7,427 |
| Maximum | $83,892 | $123,040 |
| Range | $68,660 | $115,613 |
| Mean | $38,430 | $50,621 |
| Median | $37,481 | $49,179 |
| Interquartile 25% (IQ1) | $32,272 | $40,218 |
| Interquartile 75% (IQ3) | $40,294 | $55,379 |
| Interquartile Range (IQR) | $8,022 | $15,162 |
| Standard Deviation (Sample) | $11,196 | $19,242 |
| Standard Deviation (Population) | $11,128 | $19,115 |
Similar Demographics by Per Capita Income
Demographics Similar to Danes by Per Capita Income
In terms of per capita income, the demographic groups most similar to Danes are Costa Rican ($44,090, a difference of 0.010%), South American ($44,114, a difference of 0.040%), Swiss ($44,076, a difference of 0.040%), Immigrants from South America ($44,068, a difference of 0.060%), and Sri Lankan ($44,014, a difference of 0.18%).
| Demographics | Rating | Rank | Per Capita Income |
| Scottish | 70.6 /100 | #153 | Good $44,440 |
| Portuguese | 68.7 /100 | #154 | Good $44,362 |
| Uruguayans | 67.6 /100 | #155 | Good $44,318 |
| Slovaks | 65.4 /100 | #156 | Good $44,229 |
| South American Indians | 64.8 /100 | #157 | Good $44,206 |
| Immigrants | Nepal | 64.3 /100 | #158 | Good $44,187 |
| South Americans | 62.4 /100 | #159 | Good $44,114 |
| Danes | 61.9 /100 | #160 | Good $44,095 |
| Costa Ricans | 61.8 /100 | #161 | Good $44,090 |
| Swiss | 61.4 /100 | #162 | Good $44,076 |
| Immigrants | South America | 61.2 /100 | #163 | Good $44,068 |
| Sri Lankans | 59.8 /100 | #164 | Average $44,014 |
| Immigrants | Philippines | 59.4 /100 | #165 | Average $44,000 |
| Immigrants | Uruguay | 59.3 /100 | #166 | Average $43,997 |
| English | 58.9 /100 | #167 | Average $43,982 |
Demographics Similar to Immigrants from Croatia by Per Capita Income
In terms of per capita income, the demographic groups most similar to Immigrants from Croatia are Paraguayan ($50,385, a difference of 0.060%), Immigrants from Netherlands ($50,458, a difference of 0.080%), Immigrants from Belarus ($50,303, a difference of 0.23%), Immigrants from Sri Lanka ($50,555, a difference of 0.27%), and New Zealander ($50,575, a difference of 0.31%).
| Demographics | Rating | Rank | Per Capita Income |
| Immigrants | Spain | 100.0 /100 | #45 | Exceptional $50,933 |
| Immigrants | Latvia | 100.0 /100 | #46 | Exceptional $50,914 |
| Bulgarians | 100.0 /100 | #47 | Exceptional $50,906 |
| Immigrants | Serbia | 100.0 /100 | #48 | Exceptional $50,810 |
| New Zealanders | 100.0 /100 | #49 | Exceptional $50,575 |
| Immigrants | Sri Lanka | 100.0 /100 | #50 | Exceptional $50,555 |
| Immigrants | Netherlands | 100.0 /100 | #51 | Exceptional $50,458 |
| Immigrants | Croatia | 99.9 /100 | #52 | Exceptional $50,417 |
| Paraguayans | 99.9 /100 | #53 | Exceptional $50,385 |
| Immigrants | Belarus | 99.9 /100 | #54 | Exceptional $50,303 |
| Immigrants | Western Europe | 99.9 /100 | #55 | Exceptional $50,065 |
| Asians | 99.9 /100 | #56 | Exceptional $50,057 |
| South Africans | 99.9 /100 | #57 | Exceptional $50,044 |
| Immigrants | Malaysia | 99.9 /100 | #58 | Exceptional $49,983 |
| Bhutanese | 99.9 /100 | #59 | Exceptional $49,894 |