Cuban vs Subsaharan African Professional Degree
COMPARE
Cuban
Subsaharan African
Professional Degree
Professional Degree Comparison
Cubans
Sub-Saharan Africans
4.0%
PROFESSIONAL DEGREE
5.9/ 100
METRIC RATING
227th/ 347
METRIC RANK
4.1%
PROFESSIONAL DEGREE
12.8/ 100
METRIC RATING
207th/ 347
METRIC RANK
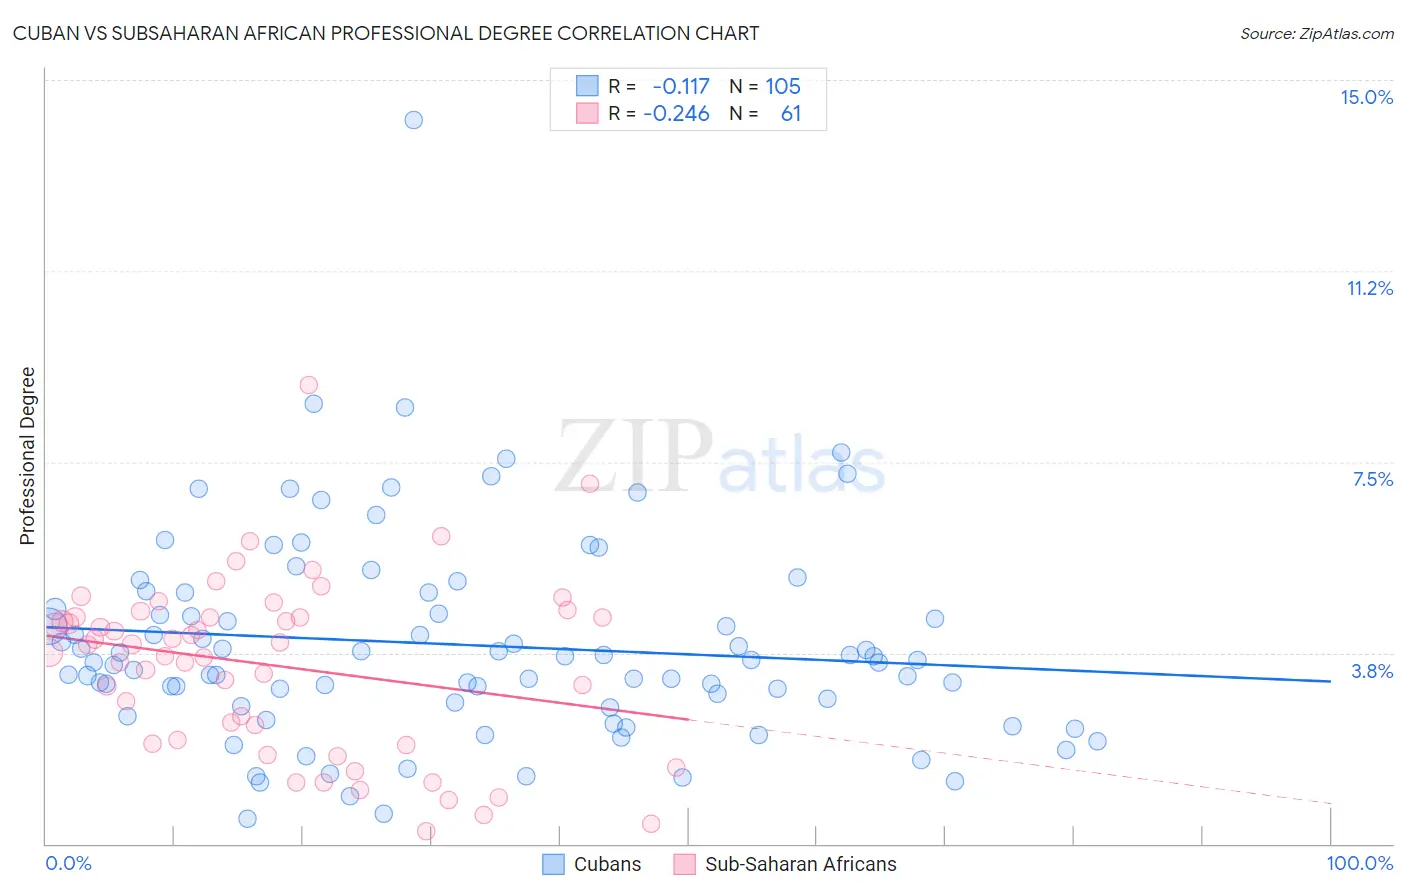
Cuban vs Subsaharan African Professional Degree Correlation Chart
The statistical analysis conducted on geographies consisting of 447,765,815 people shows a poor negative correlation between the proportion of Cubans and percentage of population with at least professional degree education in the United States with a correlation coefficient (R) of -0.117 and weighted average of 4.0%. Similarly, the statistical analysis conducted on geographies consisting of 505,148,465 people shows a weak negative correlation between the proportion of Sub-Saharan Africans and percentage of population with at least professional degree education in the United States with a correlation coefficient (R) of -0.246 and weighted average of 4.1%, a difference of 3.4%.
Professional Degree Correlation Summary
| Measurement | Cuban | Subsaharan African |
| Minimum | 0.48% | 0.23% |
| Maximum | 14.2% | 9.0% |
| Range | 13.7% | 8.8% |
| Mean | 3.9% | 3.5% |
| Median | 3.6% | 3.9% |
| Interquartile 25% (IQ1) | 2.7% | 2.0% |
| Interquartile 75% (IQ3) | 4.8% | 4.4% |
| Interquartile Range (IQR) | 2.0% | 2.4% |
| Standard Deviation (Sample) | 2.0% | 1.7% |
| Standard Deviation (Population) | 2.0% | 1.7% |
Demographics Similar to Cubans and Sub-Saharan Africans by Professional Degree
In terms of professional degree, the demographic groups most similar to Cubans are German Russian (4.0%, a difference of 0.12%), Tlingit-Haida (4.0%, a difference of 0.68%), Trinidadian and Tobagonian (4.0%, a difference of 0.81%), Immigrants from Bosnia and Herzegovina (4.0%, a difference of 0.95%), and Immigrants from Western Africa (4.0%, a difference of 1.0%). Similarly, the demographic groups most similar to Sub-Saharan Africans are Immigrants from Somalia (4.1%, a difference of 0.080%), Immigrants from Panama (4.1%, a difference of 0.16%), Immigrants from Nigeria (4.1%, a difference of 0.38%), German (4.1%, a difference of 0.42%), and White/Caucasian (4.1%, a difference of 0.59%).
| Demographics | Rating | Rank | Professional Degree |
| Sub-Saharan Africans | 12.8 /100 | #207 | Poor 4.1% |
| Immigrants | Somalia | 12.5 /100 | #208 | Poor 4.1% |
| Immigrants | Panama | 12.3 /100 | #209 | Poor 4.1% |
| Immigrants | Nigeria | 11.7 /100 | #210 | Poor 4.1% |
| Germans | 11.6 /100 | #211 | Poor 4.1% |
| Whites/Caucasians | 11.2 /100 | #212 | Poor 4.1% |
| Koreans | 10.7 /100 | #213 | Poor 4.1% |
| Immigrants | Ghana | 10.6 /100 | #214 | Poor 4.1% |
| Portuguese | 10.5 /100 | #215 | Poor 4.1% |
| West Indians | 9.8 /100 | #216 | Tragic 4.1% |
| Immigrants | Vietnam | 9.4 /100 | #217 | Tragic 4.0% |
| Dutch | 9.0 /100 | #218 | Tragic 4.0% |
| Immigrants | South Eastern Asia | 8.9 /100 | #219 | Tragic 4.0% |
| Ute | 8.2 /100 | #220 | Tragic 4.0% |
| French Canadians | 8.0 /100 | #221 | Tragic 4.0% |
| Immigrants | Western Africa | 7.5 /100 | #222 | Tragic 4.0% |
| Immigrants | Bosnia and Herzegovina | 7.4 /100 | #223 | Tragic 4.0% |
| Trinidadians and Tobagonians | 7.1 /100 | #224 | Tragic 4.0% |
| Tlingit-Haida | 6.9 /100 | #225 | Tragic 4.0% |
| German Russians | 6.1 /100 | #226 | Tragic 4.0% |
| Cubans | 5.9 /100 | #227 | Tragic 4.0% |