Cuban vs Subsaharan African Doctorate Degree
COMPARE
Cuban
Subsaharan African
Doctorate Degree
Doctorate Degree Comparison
Cubans
Sub-Saharan Africans
1.4%
DOCTORATE DEGREE
0.1/ 100
METRIC RATING
307th/ 347
METRIC RANK
1.8%
DOCTORATE DEGREE
25.1/ 100
METRIC RATING
196th/ 347
METRIC RANK
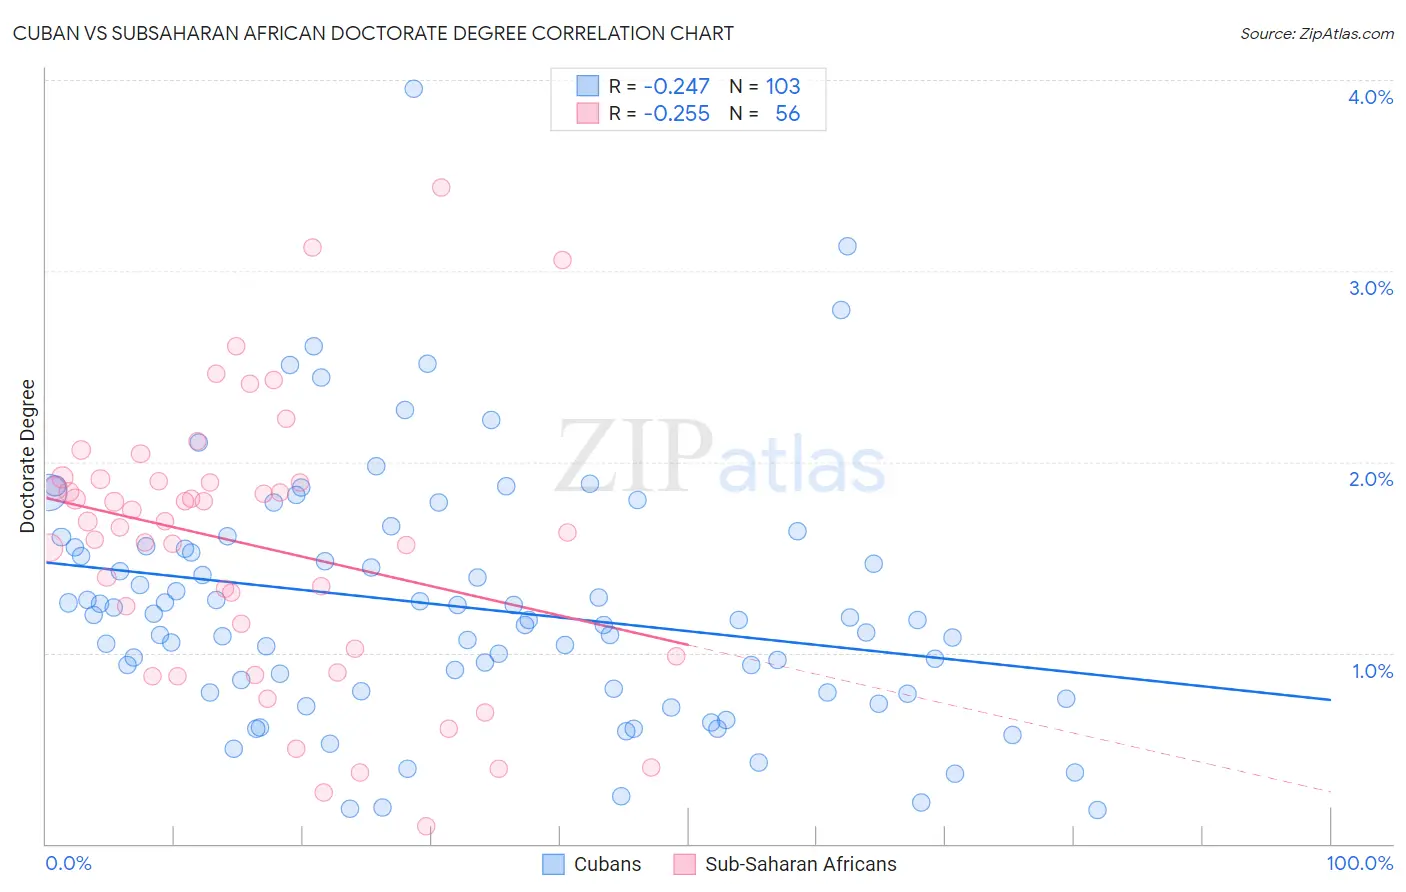
Cuban vs Subsaharan African Doctorate Degree Correlation Chart
The statistical analysis conducted on geographies consisting of 443,089,370 people shows a weak negative correlation between the proportion of Cubans and percentage of population with at least doctorate degree education in the United States with a correlation coefficient (R) of -0.247 and weighted average of 1.4%. Similarly, the statistical analysis conducted on geographies consisting of 497,272,855 people shows a weak negative correlation between the proportion of Sub-Saharan Africans and percentage of population with at least doctorate degree education in the United States with a correlation coefficient (R) of -0.255 and weighted average of 1.8%, a difference of 28.2%.
Doctorate Degree Correlation Summary
| Measurement | Cuban | Subsaharan African |
| Minimum | 0.18% | 0.094% |
| Maximum | 4.0% | 3.4% |
| Range | 3.8% | 3.3% |
| Mean | 1.2% | 1.6% |
| Median | 1.2% | 1.7% |
| Interquartile 25% (IQ1) | 0.79% | 1.0% |
| Interquartile 75% (IQ3) | 1.6% | 1.9% |
| Interquartile Range (IQR) | 0.76% | 0.89% |
| Standard Deviation (Sample) | 0.65% | 0.72% |
| Standard Deviation (Population) | 0.65% | 0.71% |
Similar Demographics by Doctorate Degree
Demographics Similar to Cubans by Doctorate Degree
In terms of doctorate degree, the demographic groups most similar to Cubans are Immigrants from Laos (1.4%, a difference of 0.050%), Guyanese (1.4%, a difference of 0.25%), Pennsylvania German (1.4%, a difference of 0.26%), Mexican American Indian (1.4%, a difference of 0.40%), and Immigrants from Dominica (1.4%, a difference of 0.45%).
| Demographics | Rating | Rank | Doctorate Degree |
| Immigrants | Guatemala | 0.1 /100 | #300 | Tragic 1.4% |
| Hondurans | 0.1 /100 | #301 | Tragic 1.4% |
| Shoshone | 0.1 /100 | #302 | Tragic 1.4% |
| Immigrants | Dominica | 0.1 /100 | #303 | Tragic 1.4% |
| Mexican American Indians | 0.1 /100 | #304 | Tragic 1.4% |
| Pennsylvania Germans | 0.1 /100 | #305 | Tragic 1.4% |
| Guyanese | 0.1 /100 | #306 | Tragic 1.4% |
| Cubans | 0.1 /100 | #307 | Tragic 1.4% |
| Immigrants | Laos | 0.1 /100 | #308 | Tragic 1.4% |
| Immigrants | Grenada | 0.1 /100 | #309 | Tragic 1.4% |
| Immigrants | Jamaica | 0.1 /100 | #310 | Tragic 1.4% |
| Immigrants | Honduras | 0.1 /100 | #311 | Tragic 1.4% |
| Immigrants | Nicaragua | 0.1 /100 | #312 | Tragic 1.4% |
| Menominee | 0.1 /100 | #313 | Tragic 1.4% |
| Dominicans | 0.1 /100 | #314 | Tragic 1.4% |
Demographics Similar to Sub-Saharan Africans by Doctorate Degree
In terms of doctorate degree, the demographic groups most similar to Sub-Saharan Africans are Chinese (1.8%, a difference of 0.0%), Immigrants from Somalia (1.8%, a difference of 0.070%), Immigrants from Ghana (1.8%, a difference of 0.090%), Uruguayan (1.8%, a difference of 0.22%), and Immigrants from South America (1.8%, a difference of 0.38%).
| Demographics | Rating | Rank | Doctorate Degree |
| French Canadians | 30.2 /100 | #189 | Fair 1.8% |
| Immigrants | Costa Rica | 30.2 /100 | #190 | Fair 1.8% |
| South Americans | 29.5 /100 | #191 | Fair 1.8% |
| Dutch | 27.4 /100 | #192 | Fair 1.8% |
| German Russians | 27.1 /100 | #193 | Fair 1.8% |
| Uruguayans | 26.2 /100 | #194 | Fair 1.8% |
| Immigrants | Somalia | 25.4 /100 | #195 | Fair 1.8% |
| Sub-Saharan Africans | 25.1 /100 | #196 | Fair 1.8% |
| Chinese | 25.1 /100 | #197 | Fair 1.8% |
| Immigrants | Ghana | 24.6 /100 | #198 | Fair 1.8% |
| Immigrants | South America | 23.3 /100 | #199 | Fair 1.8% |
| Whites/Caucasians | 22.8 /100 | #200 | Fair 1.8% |
| Immigrants | Nigeria | 22.4 /100 | #201 | Fair 1.8% |
| Portuguese | 21.4 /100 | #202 | Fair 1.8% |
| Immigrants | Vietnam | 21.4 /100 | #203 | Fair 1.8% |