Cuban vs Immigrants from Italy Median Family Income
COMPARE
Cuban
Immigrants from Italy
Median Family Income
Median Family Income Comparison
Cubans
Immigrants from Italy
$84,981
MEDIAN FAMILY INCOME
0.0/ 100
METRIC RATING
312th/ 347
METRIC RANK
$112,848
MEDIAN FAMILY INCOME
99.4/ 100
METRIC RATING
74th/ 347
METRIC RANK
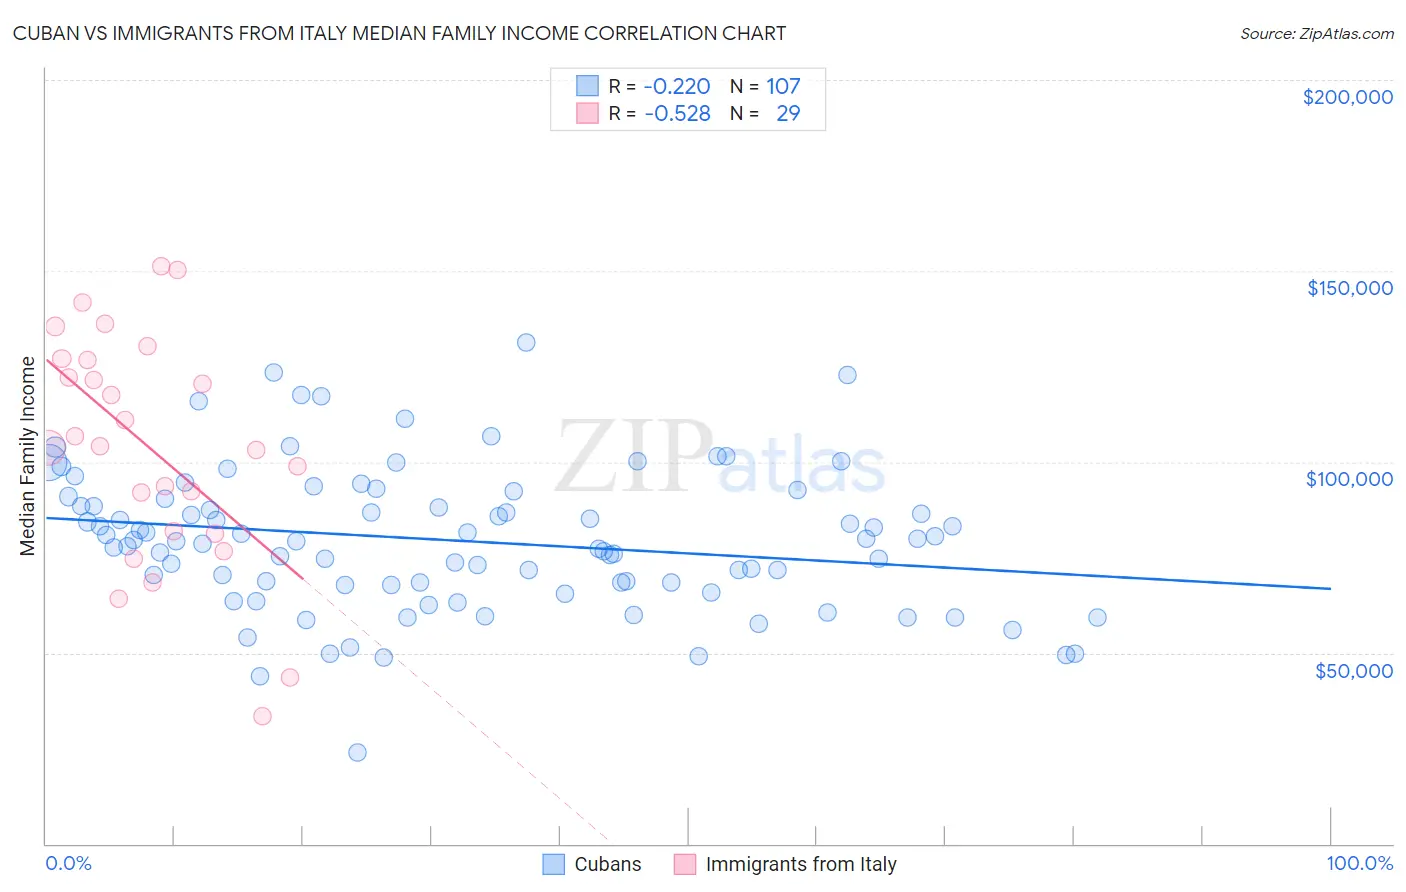
Cuban vs Immigrants from Italy Median Family Income Correlation Chart
The statistical analysis conducted on geographies consisting of 448,691,327 people shows a weak negative correlation between the proportion of Cubans and median family income in the United States with a correlation coefficient (R) of -0.220 and weighted average of $84,981. Similarly, the statistical analysis conducted on geographies consisting of 324,100,619 people shows a substantial negative correlation between the proportion of Immigrants from Italy and median family income in the United States with a correlation coefficient (R) of -0.528 and weighted average of $112,848, a difference of 32.8%.
Median Family Income Correlation Summary
| Measurement | Cuban | Immigrants from Italy |
| Minimum | $23,750 | $33,393 |
| Maximum | $131,198 | $151,250 |
| Range | $107,448 | $117,857 |
| Mean | $79,388 | $103,776 |
| Median | $79,353 | $104,131 |
| Interquartile 25% (IQ1) | $67,815 | $81,528 |
| Interquartile 75% (IQ3) | $90,371 | $126,861 |
| Interquartile Range (IQR) | $22,555 | $45,333 |
| Standard Deviation (Sample) | $18,688 | $30,032 |
| Standard Deviation (Population) | $18,601 | $29,509 |
Similar Demographics by Median Family Income
Demographics Similar to Cubans by Median Family Income
In terms of median family income, the demographic groups most similar to Cubans are Honduran ($85,004, a difference of 0.030%), Immigrants from Central America ($85,050, a difference of 0.080%), Choctaw ($84,835, a difference of 0.17%), Haitian ($85,218, a difference of 0.28%), and Immigrants from Bahamas ($84,732, a difference of 0.29%).
| Demographics | Rating | Rank | Median Family Income |
| Paiute | 0.0 /100 | #305 | Tragic $85,414 |
| Immigrants | Dominica | 0.0 /100 | #306 | Tragic $85,411 |
| Chickasaw | 0.0 /100 | #307 | Tragic $85,356 |
| U.S. Virgin Islanders | 0.0 /100 | #308 | Tragic $85,294 |
| Haitians | 0.0 /100 | #309 | Tragic $85,218 |
| Immigrants | Central America | 0.0 /100 | #310 | Tragic $85,050 |
| Hondurans | 0.0 /100 | #311 | Tragic $85,004 |
| Cubans | 0.0 /100 | #312 | Tragic $84,981 |
| Choctaw | 0.0 /100 | #313 | Tragic $84,835 |
| Immigrants | Bahamas | 0.0 /100 | #314 | Tragic $84,732 |
| Apache | 0.0 /100 | #315 | Tragic $84,451 |
| Immigrants | Haiti | 0.0 /100 | #316 | Tragic $84,018 |
| Yakama | 0.0 /100 | #317 | Tragic $83,932 |
| Immigrants | Mexico | 0.0 /100 | #318 | Tragic $83,639 |
| Immigrants | Honduras | 0.0 /100 | #319 | Tragic $83,618 |
Demographics Similar to Immigrants from Italy by Median Family Income
In terms of median family income, the demographic groups most similar to Immigrants from Italy are Laotian ($112,859, a difference of 0.010%), Afghan ($112,971, a difference of 0.11%), Immigrants from Western Europe ($112,688, a difference of 0.14%), Argentinean ($112,665, a difference of 0.16%), and Immigrants from Eastern Europe ($112,527, a difference of 0.29%).
| Demographics | Rating | Rank | Median Family Income |
| Immigrants | Spain | 99.7 /100 | #67 | Exceptional $113,815 |
| Immigrants | Serbia | 99.6 /100 | #68 | Exceptional $113,463 |
| Immigrants | Bulgaria | 99.6 /100 | #69 | Exceptional $113,461 |
| Immigrants | Romania | 99.6 /100 | #70 | Exceptional $113,434 |
| South Africans | 99.5 /100 | #71 | Exceptional $113,229 |
| Afghans | 99.5 /100 | #72 | Exceptional $112,971 |
| Laotians | 99.5 /100 | #73 | Exceptional $112,859 |
| Immigrants | Italy | 99.4 /100 | #74 | Exceptional $112,848 |
| Immigrants | Western Europe | 99.4 /100 | #75 | Exceptional $112,688 |
| Argentineans | 99.4 /100 | #76 | Exceptional $112,665 |
| Immigrants | Eastern Europe | 99.4 /100 | #77 | Exceptional $112,527 |
| Immigrants | Canada | 99.3 /100 | #78 | Exceptional $112,374 |
| Italians | 99.3 /100 | #79 | Exceptional $112,372 |
| Immigrants | Croatia | 99.3 /100 | #80 | Exceptional $112,323 |
| Immigrants | North America | 99.2 /100 | #81 | Exceptional $112,151 |