Cuban vs Immigrants from Greece Median Family Income
COMPARE
Cuban
Immigrants from Greece
Median Family Income
Median Family Income Comparison
Cubans
Immigrants from Greece
$84,981
MEDIAN FAMILY INCOME
0.0/ 100
METRIC RATING
312th/ 347
METRIC RANK
$117,344
MEDIAN FAMILY INCOME
99.9/ 100
METRIC RATING
45th/ 347
METRIC RANK
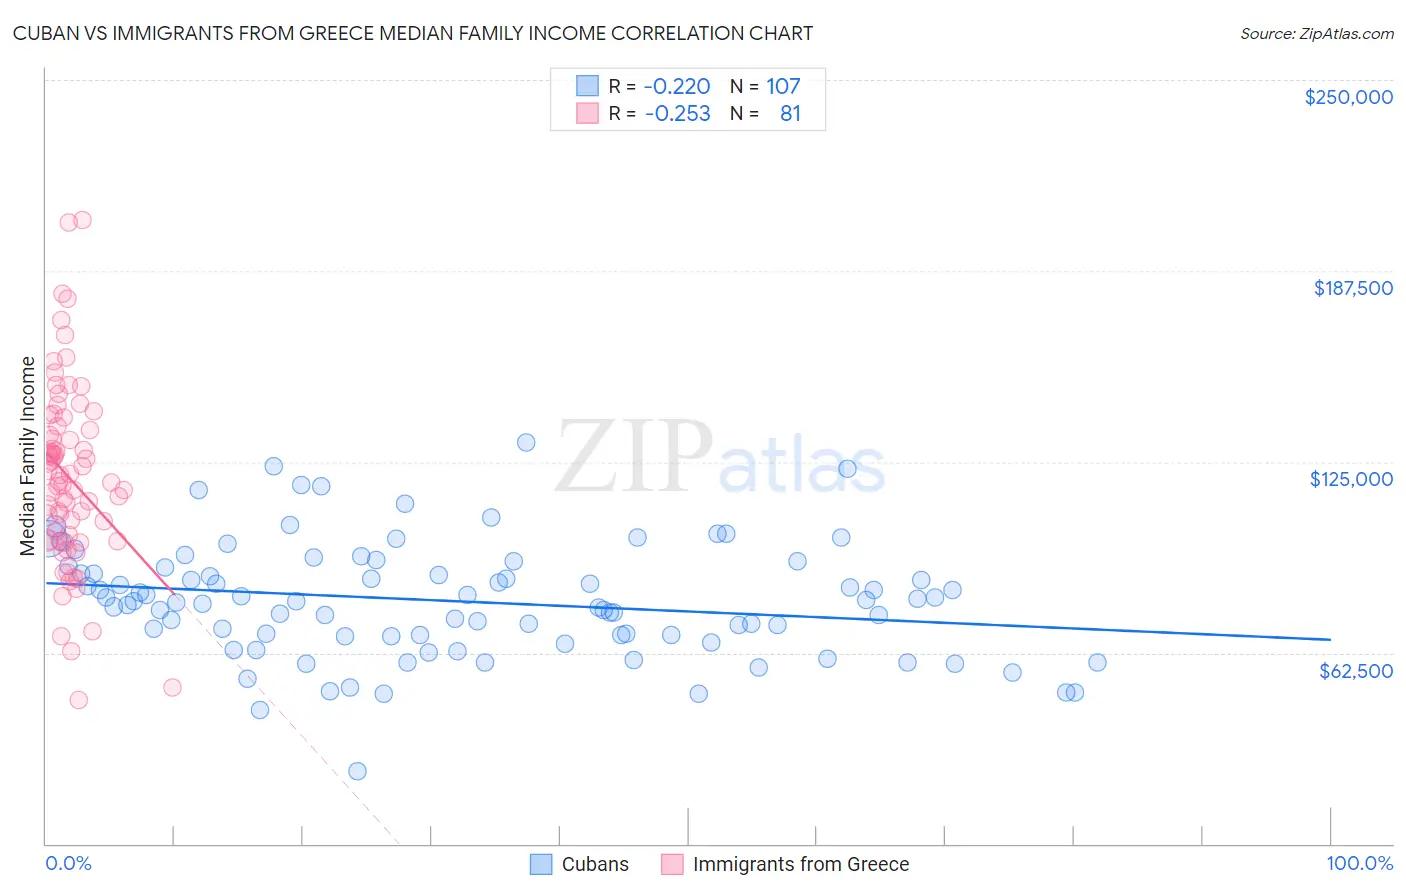
Cuban vs Immigrants from Greece Median Family Income Correlation Chart
The statistical analysis conducted on geographies consisting of 448,691,327 people shows a weak negative correlation between the proportion of Cubans and median family income in the United States with a correlation coefficient (R) of -0.220 and weighted average of $84,981. Similarly, the statistical analysis conducted on geographies consisting of 216,841,936 people shows a weak negative correlation between the proportion of Immigrants from Greece and median family income in the United States with a correlation coefficient (R) of -0.253 and weighted average of $117,344, a difference of 38.1%.
Median Family Income Correlation Summary
| Measurement | Cuban | Immigrants from Greece |
| Minimum | $23,750 | $46,875 |
| Maximum | $131,198 | $204,250 |
| Range | $107,448 | $157,375 |
| Mean | $79,388 | $119,942 |
| Median | $79,353 | $118,534 |
| Interquartile 25% (IQ1) | $67,815 | $99,330 |
| Interquartile 75% (IQ3) | $90,371 | $136,059 |
| Interquartile Range (IQR) | $22,555 | $36,729 |
| Standard Deviation (Sample) | $18,688 | $29,797 |
| Standard Deviation (Population) | $18,601 | $29,612 |
Similar Demographics by Median Family Income
Demographics Similar to Cubans by Median Family Income
In terms of median family income, the demographic groups most similar to Cubans are Honduran ($85,004, a difference of 0.030%), Immigrants from Central America ($85,050, a difference of 0.080%), Choctaw ($84,835, a difference of 0.17%), Haitian ($85,218, a difference of 0.28%), and Immigrants from Bahamas ($84,732, a difference of 0.29%).
| Demographics | Rating | Rank | Median Family Income |
| Paiute | 0.0 /100 | #305 | Tragic $85,414 |
| Immigrants | Dominica | 0.0 /100 | #306 | Tragic $85,411 |
| Chickasaw | 0.0 /100 | #307 | Tragic $85,356 |
| U.S. Virgin Islanders | 0.0 /100 | #308 | Tragic $85,294 |
| Haitians | 0.0 /100 | #309 | Tragic $85,218 |
| Immigrants | Central America | 0.0 /100 | #310 | Tragic $85,050 |
| Hondurans | 0.0 /100 | #311 | Tragic $85,004 |
| Cubans | 0.0 /100 | #312 | Tragic $84,981 |
| Choctaw | 0.0 /100 | #313 | Tragic $84,835 |
| Immigrants | Bahamas | 0.0 /100 | #314 | Tragic $84,732 |
| Apache | 0.0 /100 | #315 | Tragic $84,451 |
| Immigrants | Haiti | 0.0 /100 | #316 | Tragic $84,018 |
| Yakama | 0.0 /100 | #317 | Tragic $83,932 |
| Immigrants | Mexico | 0.0 /100 | #318 | Tragic $83,639 |
| Immigrants | Honduras | 0.0 /100 | #319 | Tragic $83,618 |
Demographics Similar to Immigrants from Greece by Median Family Income
In terms of median family income, the demographic groups most similar to Immigrants from Greece are Immigrants from Russia ($116,942, a difference of 0.34%), Cambodian ($117,780, a difference of 0.37%), Bulgarian ($117,818, a difference of 0.40%), Immigrants from Austria ($116,830, a difference of 0.44%), and Immigrants from Bolivia ($117,912, a difference of 0.48%).
| Demographics | Rating | Rank | Median Family Income |
| Immigrants | Turkey | 100.0 /100 | #38 | Exceptional $118,325 |
| Immigrants | Asia | 100.0 /100 | #39 | Exceptional $118,291 |
| Immigrants | Lithuania | 100.0 /100 | #40 | Exceptional $118,053 |
| Estonians | 100.0 /100 | #41 | Exceptional $118,013 |
| Immigrants | Bolivia | 100.0 /100 | #42 | Exceptional $117,912 |
| Bulgarians | 100.0 /100 | #43 | Exceptional $117,818 |
| Cambodians | 100.0 /100 | #44 | Exceptional $117,780 |
| Immigrants | Greece | 99.9 /100 | #45 | Exceptional $117,344 |
| Immigrants | Russia | 99.9 /100 | #46 | Exceptional $116,942 |
| Immigrants | Austria | 99.9 /100 | #47 | Exceptional $116,830 |
| Immigrants | South Africa | 99.9 /100 | #48 | Exceptional $116,286 |
| Chinese | 99.9 /100 | #49 | Exceptional $116,188 |
| Immigrants | Czechoslovakia | 99.9 /100 | #50 | Exceptional $116,165 |
| Immigrants | Malaysia | 99.9 /100 | #51 | Exceptional $115,880 |
| Maltese | 99.9 /100 | #52 | Exceptional $115,862 |