Cuban vs Panamanian Median Family Income
COMPARE
Cuban
Panamanian
Median Family Income
Median Family Income Comparison
Cubans
Panamanians
$84,981
MEDIAN FAMILY INCOME
0.0/ 100
METRIC RATING
312th/ 347
METRIC RANK
$97,683
MEDIAN FAMILY INCOME
7.2/ 100
METRIC RATING
212th/ 347
METRIC RANK
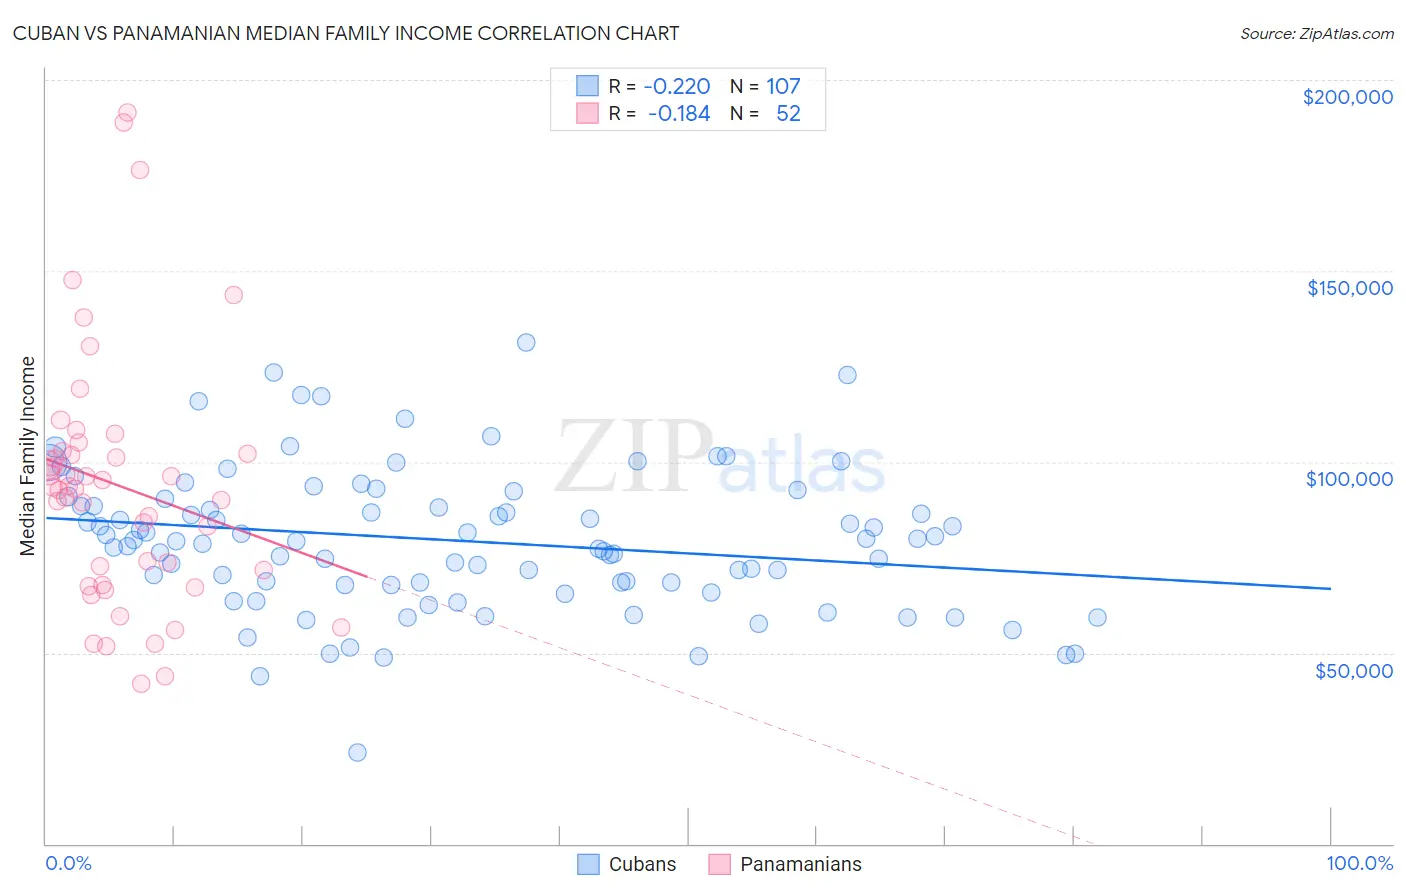
Cuban vs Panamanian Median Family Income Correlation Chart
The statistical analysis conducted on geographies consisting of 448,691,327 people shows a weak negative correlation between the proportion of Cubans and median family income in the United States with a correlation coefficient (R) of -0.220 and weighted average of $84,981. Similarly, the statistical analysis conducted on geographies consisting of 281,027,872 people shows a poor negative correlation between the proportion of Panamanians and median family income in the United States with a correlation coefficient (R) of -0.184 and weighted average of $97,683, a difference of 14.9%.
Median Family Income Correlation Summary
| Measurement | Cuban | Panamanian |
| Minimum | $23,750 | $41,845 |
| Maximum | $131,198 | $191,635 |
| Range | $107,448 | $149,790 |
| Mean | $79,388 | $93,845 |
| Median | $79,353 | $93,176 |
| Interquartile 25% (IQ1) | $67,815 | $69,694 |
| Interquartile 75% (IQ3) | $90,371 | $102,381 |
| Interquartile Range (IQR) | $22,555 | $32,687 |
| Standard Deviation (Sample) | $18,688 | $33,147 |
| Standard Deviation (Population) | $18,601 | $32,827 |
Similar Demographics by Median Family Income
Demographics Similar to Cubans by Median Family Income
In terms of median family income, the demographic groups most similar to Cubans are Honduran ($85,004, a difference of 0.030%), Immigrants from Central America ($85,050, a difference of 0.080%), Choctaw ($84,835, a difference of 0.17%), Haitian ($85,218, a difference of 0.28%), and Immigrants from Bahamas ($84,732, a difference of 0.29%).
| Demographics | Rating | Rank | Median Family Income |
| Paiute | 0.0 /100 | #305 | Tragic $85,414 |
| Immigrants | Dominica | 0.0 /100 | #306 | Tragic $85,411 |
| Chickasaw | 0.0 /100 | #307 | Tragic $85,356 |
| U.S. Virgin Islanders | 0.0 /100 | #308 | Tragic $85,294 |
| Haitians | 0.0 /100 | #309 | Tragic $85,218 |
| Immigrants | Central America | 0.0 /100 | #310 | Tragic $85,050 |
| Hondurans | 0.0 /100 | #311 | Tragic $85,004 |
| Cubans | 0.0 /100 | #312 | Tragic $84,981 |
| Choctaw | 0.0 /100 | #313 | Tragic $84,835 |
| Immigrants | Bahamas | 0.0 /100 | #314 | Tragic $84,732 |
| Apache | 0.0 /100 | #315 | Tragic $84,451 |
| Immigrants | Haiti | 0.0 /100 | #316 | Tragic $84,018 |
| Yakama | 0.0 /100 | #317 | Tragic $83,932 |
| Immigrants | Mexico | 0.0 /100 | #318 | Tragic $83,639 |
| Immigrants | Honduras | 0.0 /100 | #319 | Tragic $83,618 |
Demographics Similar to Panamanians by Median Family Income
In terms of median family income, the demographic groups most similar to Panamanians are Immigrants from Sudan ($97,737, a difference of 0.050%), Immigrants from Armenia ($97,605, a difference of 0.080%), Bermudan ($97,577, a difference of 0.11%), Nigerian ($97,522, a difference of 0.17%), and Immigrants from Bosnia and Herzegovina ($97,432, a difference of 0.26%).
| Demographics | Rating | Rank | Median Family Income |
| Hawaiians | 12.5 /100 | #205 | Poor $98,869 |
| Immigrants | Iraq | 12.1 /100 | #206 | Poor $98,786 |
| Aleuts | 11.6 /100 | #207 | Poor $98,702 |
| Immigrants | Uruguay | 9.2 /100 | #208 | Tragic $98,205 |
| Immigrants | Colombia | 8.7 /100 | #209 | Tragic $98,067 |
| Puget Sound Salish | 8.2 /100 | #210 | Tragic $97,958 |
| Immigrants | Sudan | 7.4 /100 | #211 | Tragic $97,737 |
| Panamanians | 7.2 /100 | #212 | Tragic $97,683 |
| Immigrants | Armenia | 7.0 /100 | #213 | Tragic $97,605 |
| Bermudans | 6.9 /100 | #214 | Tragic $97,577 |
| Nigerians | 6.7 /100 | #215 | Tragic $97,522 |
| Immigrants | Bosnia and Herzegovina | 6.4 /100 | #216 | Tragic $97,432 |
| Japanese | 6.0 /100 | #217 | Tragic $97,288 |
| Immigrants | Cambodia | 5.8 /100 | #218 | Tragic $97,222 |
| Delaware | 5.1 /100 | #219 | Tragic $96,958 |