Yaqui vs Immigrants from West Indies Median Family Income
COMPARE
Yaqui
Immigrants from West Indies
Median Family Income
Median Family Income Comparison
Yaqui
Immigrants from West Indies
$87,289
MEDIAN FAMILY INCOME
0.0/ 100
METRIC RATING
295th/ 347
METRIC RANK
$91,588
MEDIAN FAMILY INCOME
0.3/ 100
METRIC RATING
263rd/ 347
METRIC RANK
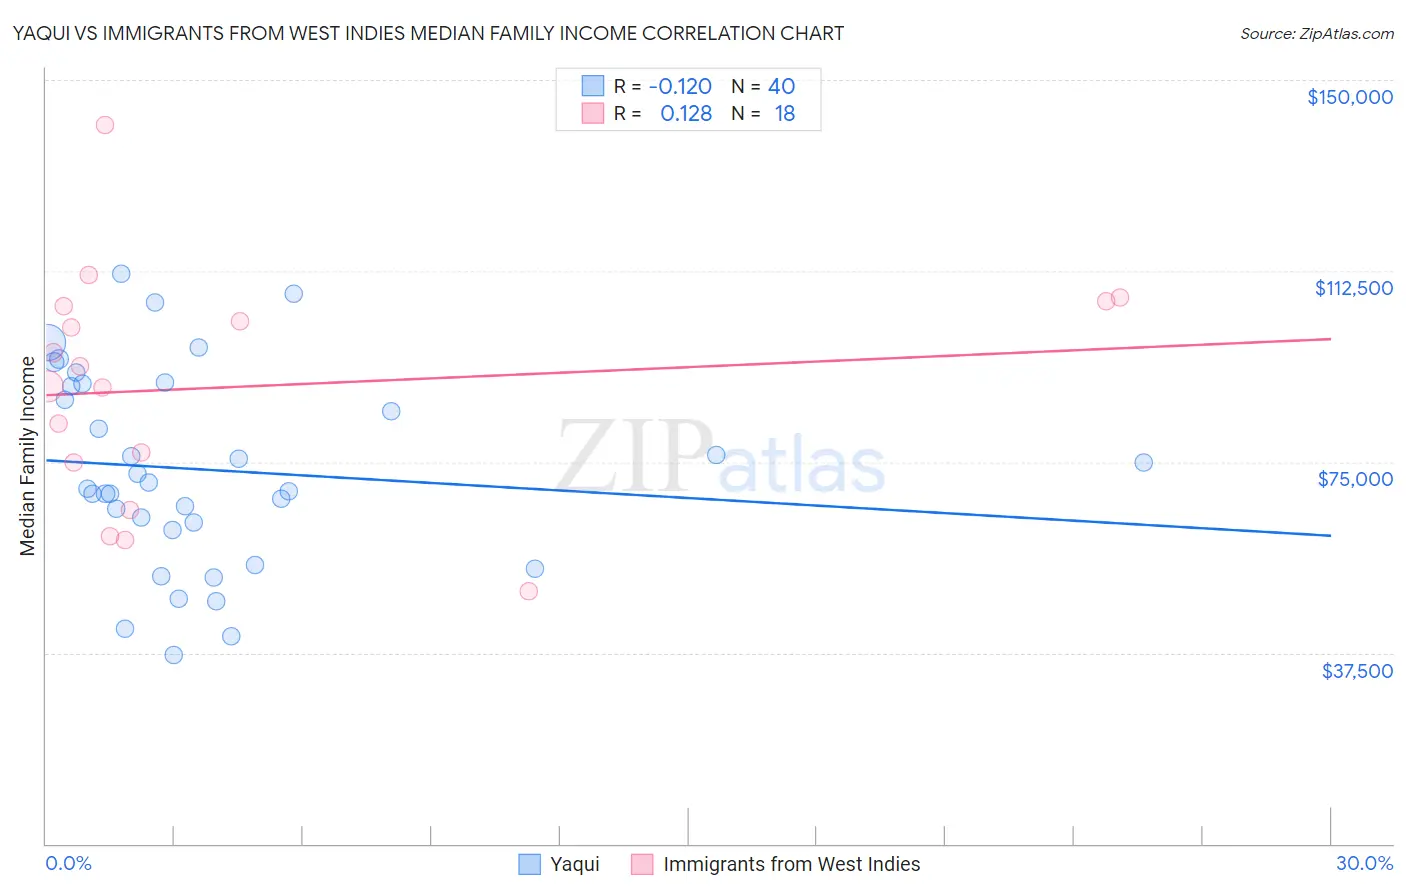
Yaqui vs Immigrants from West Indies Median Family Income Correlation Chart
The statistical analysis conducted on geographies consisting of 107,704,504 people shows a poor negative correlation between the proportion of Yaqui and median family income in the United States with a correlation coefficient (R) of -0.120 and weighted average of $87,289. Similarly, the statistical analysis conducted on geographies consisting of 72,412,445 people shows a poor positive correlation between the proportion of Immigrants from West Indies and median family income in the United States with a correlation coefficient (R) of 0.128 and weighted average of $91,588, a difference of 4.9%.
Median Family Income Correlation Summary
| Measurement | Yaqui | Immigrants from West Indies |
| Minimum | $37,174 | $49,539 |
| Maximum | $111,841 | $141,054 |
| Range | $74,667 | $91,515 |
| Mean | $73,462 | $89,730 |
| Median | $70,310 | $91,813 |
| Interquartile 25% (IQ1) | $62,336 | $74,771 |
| Interquartile 75% (IQ3) | $90,136 | $105,524 |
| Interquartile Range (IQR) | $27,800 | $30,753 |
| Standard Deviation (Sample) | $19,183 | $22,647 |
| Standard Deviation (Population) | $18,942 | $22,009 |
Similar Demographics by Median Family Income
Demographics Similar to Yaqui by Median Family Income
In terms of median family income, the demographic groups most similar to Yaqui are Fijian ($87,387, a difference of 0.11%), Immigrants from Guatemala ($87,191, a difference of 0.11%), Cajun ($87,157, a difference of 0.15%), Immigrants from Latin America ($86,989, a difference of 0.34%), and Ute ($87,596, a difference of 0.35%).
| Demographics | Rating | Rank | Median Family Income |
| Cherokee | 0.1 /100 | #288 | Tragic $88,209 |
| Central American Indians | 0.1 /100 | #289 | Tragic $88,034 |
| Shoshone | 0.1 /100 | #290 | Tragic $87,872 |
| Immigrants | Cabo Verde | 0.1 /100 | #291 | Tragic $87,830 |
| Africans | 0.1 /100 | #292 | Tragic $87,820 |
| Ute | 0.0 /100 | #293 | Tragic $87,596 |
| Fijians | 0.0 /100 | #294 | Tragic $87,387 |
| Yaqui | 0.0 /100 | #295 | Tragic $87,289 |
| Immigrants | Guatemala | 0.0 /100 | #296 | Tragic $87,191 |
| Cajuns | 0.0 /100 | #297 | Tragic $87,157 |
| Immigrants | Latin America | 0.0 /100 | #298 | Tragic $86,989 |
| Chippewa | 0.0 /100 | #299 | Tragic $86,852 |
| Ottawa | 0.0 /100 | #300 | Tragic $86,380 |
| Colville | 0.0 /100 | #301 | Tragic $85,792 |
| Spanish American Indians | 0.0 /100 | #302 | Tragic $85,728 |
Demographics Similar to Immigrants from West Indies by Median Family Income
In terms of median family income, the demographic groups most similar to Immigrants from West Indies are Senegalese ($91,475, a difference of 0.12%), Liberian ($91,722, a difference of 0.15%), Inupiat ($91,730, a difference of 0.16%), Pennsylvania German ($91,763, a difference of 0.19%), and Cape Verdean ($91,848, a difference of 0.28%).
| Demographics | Rating | Rank | Median Family Income |
| Nicaraguans | 0.5 /100 | #256 | Tragic $92,231 |
| Americans | 0.4 /100 | #257 | Tragic $92,096 |
| Osage | 0.4 /100 | #258 | Tragic $91,926 |
| Cape Verdeans | 0.4 /100 | #259 | Tragic $91,848 |
| Pennsylvania Germans | 0.4 /100 | #260 | Tragic $91,763 |
| Inupiat | 0.4 /100 | #261 | Tragic $91,730 |
| Liberians | 0.4 /100 | #262 | Tragic $91,722 |
| Immigrants | West Indies | 0.3 /100 | #263 | Tragic $91,588 |
| Senegalese | 0.3 /100 | #264 | Tragic $91,475 |
| Hmong | 0.3 /100 | #265 | Tragic $91,296 |
| Central Americans | 0.3 /100 | #266 | Tragic $91,087 |
| Mexican American Indians | 0.2 /100 | #267 | Tragic $90,918 |
| Cree | 0.2 /100 | #268 | Tragic $90,882 |
| Belizeans | 0.2 /100 | #269 | Tragic $90,880 |
| Jamaicans | 0.2 /100 | #270 | Tragic $90,581 |