Cuban vs Immigrants from Nepal Median Family Income
COMPARE
Cuban
Immigrants from Nepal
Median Family Income
Median Family Income Comparison
Cubans
Immigrants from Nepal
$84,981
MEDIAN FAMILY INCOME
0.0/ 100
METRIC RATING
312th/ 347
METRIC RANK
$104,966
MEDIAN FAMILY INCOME
76.3/ 100
METRIC RATING
154th/ 347
METRIC RANK
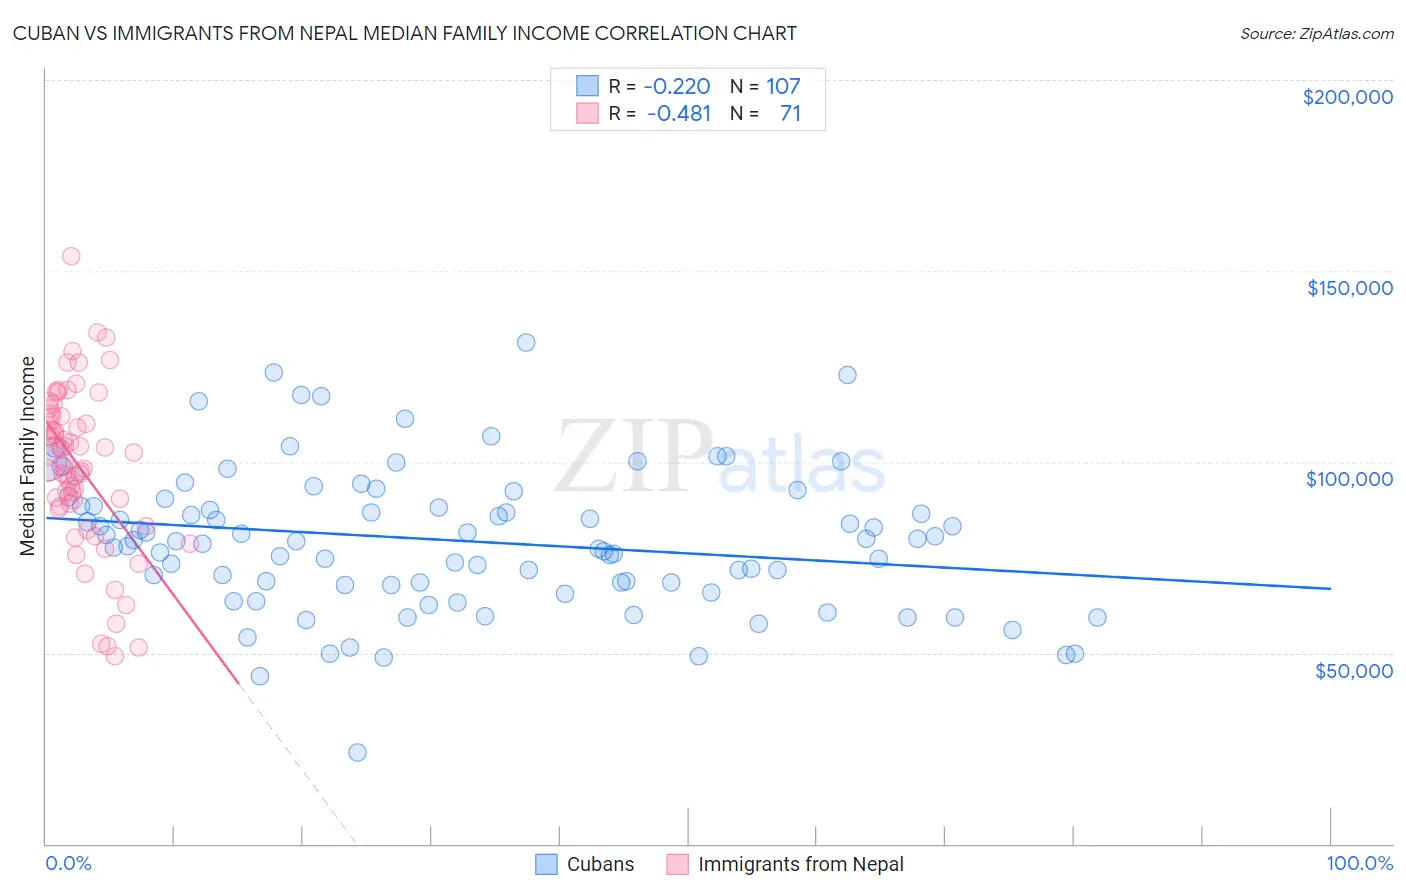
Cuban vs Immigrants from Nepal Median Family Income Correlation Chart
The statistical analysis conducted on geographies consisting of 448,691,327 people shows a weak negative correlation between the proportion of Cubans and median family income in the United States with a correlation coefficient (R) of -0.220 and weighted average of $84,981. Similarly, the statistical analysis conducted on geographies consisting of 186,649,398 people shows a moderate negative correlation between the proportion of Immigrants from Nepal and median family income in the United States with a correlation coefficient (R) of -0.481 and weighted average of $104,966, a difference of 23.5%.
Median Family Income Correlation Summary
| Measurement | Cuban | Immigrants from Nepal |
| Minimum | $23,750 | $49,167 |
| Maximum | $131,198 | $153,934 |
| Range | $107,448 | $104,767 |
| Mean | $79,388 | $98,602 |
| Median | $79,353 | $101,530 |
| Interquartile 25% (IQ1) | $67,815 | $88,483 |
| Interquartile 75% (IQ3) | $90,371 | $112,054 |
| Interquartile Range (IQR) | $22,555 | $23,571 |
| Standard Deviation (Sample) | $18,688 | $21,122 |
| Standard Deviation (Population) | $18,601 | $20,972 |
Similar Demographics by Median Family Income
Demographics Similar to Cubans by Median Family Income
In terms of median family income, the demographic groups most similar to Cubans are Honduran ($85,004, a difference of 0.030%), Immigrants from Central America ($85,050, a difference of 0.080%), Choctaw ($84,835, a difference of 0.17%), Haitian ($85,218, a difference of 0.28%), and Immigrants from Bahamas ($84,732, a difference of 0.29%).
| Demographics | Rating | Rank | Median Family Income |
| Paiute | 0.0 /100 | #305 | Tragic $85,414 |
| Immigrants | Dominica | 0.0 /100 | #306 | Tragic $85,411 |
| Chickasaw | 0.0 /100 | #307 | Tragic $85,356 |
| U.S. Virgin Islanders | 0.0 /100 | #308 | Tragic $85,294 |
| Haitians | 0.0 /100 | #309 | Tragic $85,218 |
| Immigrants | Central America | 0.0 /100 | #310 | Tragic $85,050 |
| Hondurans | 0.0 /100 | #311 | Tragic $85,004 |
| Cubans | 0.0 /100 | #312 | Tragic $84,981 |
| Choctaw | 0.0 /100 | #313 | Tragic $84,835 |
| Immigrants | Bahamas | 0.0 /100 | #314 | Tragic $84,732 |
| Apache | 0.0 /100 | #315 | Tragic $84,451 |
| Immigrants | Haiti | 0.0 /100 | #316 | Tragic $84,018 |
| Yakama | 0.0 /100 | #317 | Tragic $83,932 |
| Immigrants | Mexico | 0.0 /100 | #318 | Tragic $83,639 |
| Immigrants | Honduras | 0.0 /100 | #319 | Tragic $83,618 |
Demographics Similar to Immigrants from Nepal by Median Family Income
In terms of median family income, the demographic groups most similar to Immigrants from Nepal are Native Hawaiian ($104,910, a difference of 0.050%), Slavic ($105,144, a difference of 0.17%), Basque ($104,760, a difference of 0.20%), Immigrants from Albania ($105,285, a difference of 0.30%), and Peruvian ($105,444, a difference of 0.45%).
| Demographics | Rating | Rank | Median Family Income |
| Immigrants | Chile | 82.1 /100 | #147 | Excellent $105,655 |
| Hungarians | 81.7 /100 | #148 | Excellent $105,609 |
| Immigrants | Germany | 80.9 /100 | #149 | Excellent $105,507 |
| Irish | 80.5 /100 | #150 | Excellent $105,453 |
| Peruvians | 80.4 /100 | #151 | Excellent $105,444 |
| Immigrants | Albania | 79.1 /100 | #152 | Good $105,285 |
| Slavs | 77.9 /100 | #153 | Good $105,144 |
| Immigrants | Nepal | 76.3 /100 | #154 | Good $104,966 |
| Native Hawaiians | 75.8 /100 | #155 | Good $104,910 |
| Basques | 74.4 /100 | #156 | Good $104,760 |
| Moroccans | 71.6 /100 | #157 | Good $104,488 |
| Scandinavians | 70.8 /100 | #158 | Good $104,410 |
| Swiss | 70.7 /100 | #159 | Good $104,396 |
| Scottish | 69.5 /100 | #160 | Good $104,288 |
| Icelanders | 69.4 /100 | #161 | Good $104,282 |