Cuban vs Carpatho Rusyn Median Family Income
COMPARE
Cuban
Carpatho Rusyn
Median Family Income
Median Family Income Comparison
Cubans
Carpatho Rusyns
$84,981
MEDIAN FAMILY INCOME
0.0/ 100
METRIC RATING
312th/ 347
METRIC RANK
$107,502
MEDIAN FAMILY INCOME
92.2/ 100
METRIC RATING
123rd/ 347
METRIC RANK
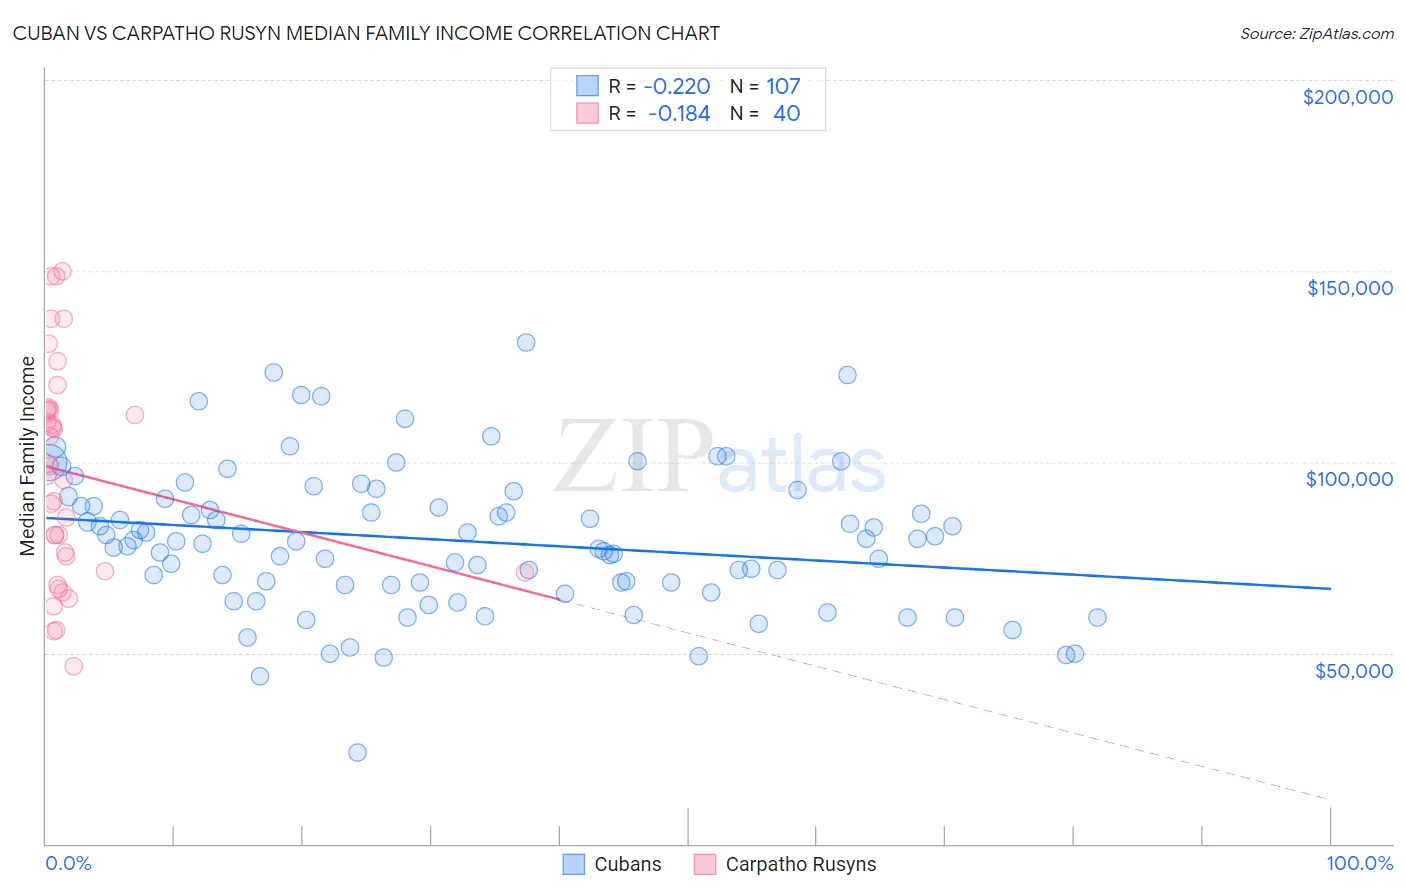
Cuban vs Carpatho Rusyn Median Family Income Correlation Chart
The statistical analysis conducted on geographies consisting of 448,691,327 people shows a weak negative correlation between the proportion of Cubans and median family income in the United States with a correlation coefficient (R) of -0.220 and weighted average of $84,981. Similarly, the statistical analysis conducted on geographies consisting of 58,866,021 people shows a poor negative correlation between the proportion of Carpatho Rusyns and median family income in the United States with a correlation coefficient (R) of -0.184 and weighted average of $107,502, a difference of 26.5%.
Median Family Income Correlation Summary
| Measurement | Cuban | Carpatho Rusyn |
| Minimum | $23,750 | $46,375 |
| Maximum | $131,198 | $150,052 |
| Range | $107,448 | $103,677 |
| Mean | $79,388 | $97,160 |
| Median | $79,353 | $97,813 |
| Interquartile 25% (IQ1) | $67,815 | $73,203 |
| Interquartile 75% (IQ3) | $90,371 | $113,650 |
| Interquartile Range (IQR) | $22,555 | $40,447 |
| Standard Deviation (Sample) | $18,688 | $27,905 |
| Standard Deviation (Population) | $18,601 | $27,554 |
Similar Demographics by Median Family Income
Demographics Similar to Cubans by Median Family Income
In terms of median family income, the demographic groups most similar to Cubans are Honduran ($85,004, a difference of 0.030%), Immigrants from Central America ($85,050, a difference of 0.080%), Choctaw ($84,835, a difference of 0.17%), Haitian ($85,218, a difference of 0.28%), and Immigrants from Bahamas ($84,732, a difference of 0.29%).
| Demographics | Rating | Rank | Median Family Income |
| Paiute | 0.0 /100 | #305 | Tragic $85,414 |
| Immigrants | Dominica | 0.0 /100 | #306 | Tragic $85,411 |
| Chickasaw | 0.0 /100 | #307 | Tragic $85,356 |
| U.S. Virgin Islanders | 0.0 /100 | #308 | Tragic $85,294 |
| Haitians | 0.0 /100 | #309 | Tragic $85,218 |
| Immigrants | Central America | 0.0 /100 | #310 | Tragic $85,050 |
| Hondurans | 0.0 /100 | #311 | Tragic $85,004 |
| Cubans | 0.0 /100 | #312 | Tragic $84,981 |
| Choctaw | 0.0 /100 | #313 | Tragic $84,835 |
| Immigrants | Bahamas | 0.0 /100 | #314 | Tragic $84,732 |
| Apache | 0.0 /100 | #315 | Tragic $84,451 |
| Immigrants | Haiti | 0.0 /100 | #316 | Tragic $84,018 |
| Yakama | 0.0 /100 | #317 | Tragic $83,932 |
| Immigrants | Mexico | 0.0 /100 | #318 | Tragic $83,639 |
| Immigrants | Honduras | 0.0 /100 | #319 | Tragic $83,618 |
Demographics Similar to Carpatho Rusyns by Median Family Income
In terms of median family income, the demographic groups most similar to Carpatho Rusyns are Pakistani ($107,390, a difference of 0.11%), Taiwanese ($107,295, a difference of 0.19%), Immigrants from Jordan ($107,715, a difference of 0.20%), Serbian ($107,157, a difference of 0.32%), and Lebanese ($107,086, a difference of 0.39%).
| Demographics | Rating | Rank | Median Family Income |
| Chileans | 95.0 /100 | #116 | Exceptional $108,429 |
| Immigrants | Philippines | 94.6 /100 | #117 | Exceptional $108,288 |
| Ethiopians | 94.5 /100 | #118 | Exceptional $108,251 |
| Sri Lankans | 94.5 /100 | #119 | Exceptional $108,234 |
| Immigrants | Northern Africa | 94.3 /100 | #120 | Exceptional $108,161 |
| Europeans | 94.1 /100 | #121 | Exceptional $108,099 |
| Immigrants | Jordan | 92.9 /100 | #122 | Exceptional $107,715 |
| Carpatho Rusyns | 92.2 /100 | #123 | Exceptional $107,502 |
| Pakistanis | 91.7 /100 | #124 | Exceptional $107,390 |
| Taiwanese | 91.4 /100 | #125 | Exceptional $107,295 |
| Serbians | 90.8 /100 | #126 | Exceptional $107,157 |
| Lebanese | 90.5 /100 | #127 | Exceptional $107,086 |
| Immigrants | Ethiopia | 90.0 /100 | #128 | Excellent $106,969 |
| Arabs | 89.9 /100 | #129 | Excellent $106,952 |
| Brazilians | 89.8 /100 | #130 | Excellent $106,942 |