Cuban vs Immigrants from Uzbekistan Median Family Income
COMPARE
Cuban
Immigrants from Uzbekistan
Median Family Income
Median Family Income Comparison
Cubans
Immigrants from Uzbekistan
$84,981
MEDIAN FAMILY INCOME
0.0/ 100
METRIC RATING
312th/ 347
METRIC RANK
$103,197
MEDIAN FAMILY INCOME
56.6/ 100
METRIC RATING
170th/ 347
METRIC RANK
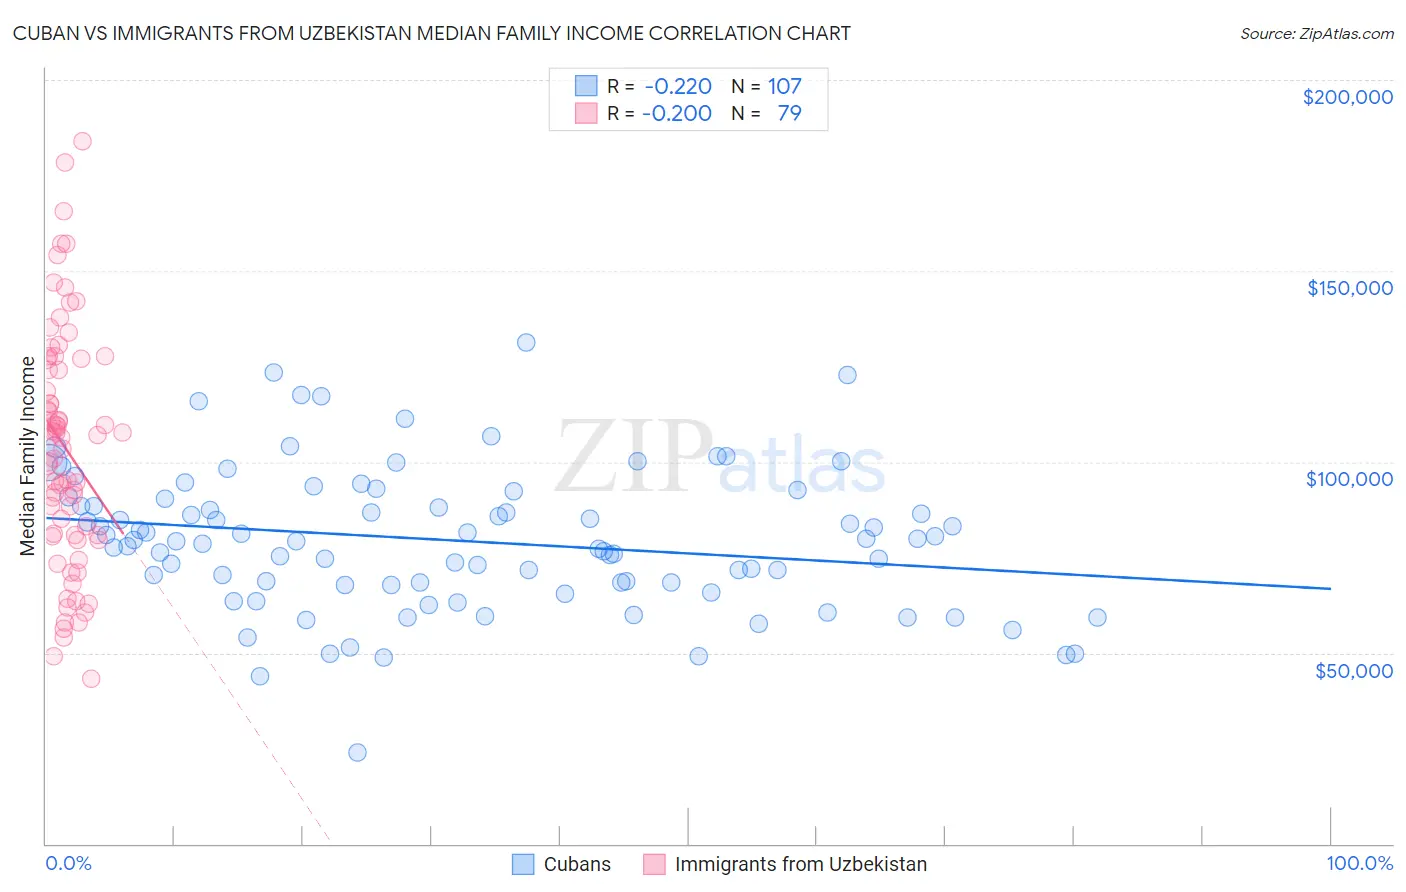
Cuban vs Immigrants from Uzbekistan Median Family Income Correlation Chart
The statistical analysis conducted on geographies consisting of 448,691,327 people shows a weak negative correlation between the proportion of Cubans and median family income in the United States with a correlation coefficient (R) of -0.220 and weighted average of $84,981. Similarly, the statistical analysis conducted on geographies consisting of 118,698,354 people shows a poor negative correlation between the proportion of Immigrants from Uzbekistan and median family income in the United States with a correlation coefficient (R) of -0.200 and weighted average of $103,197, a difference of 21.4%.
Median Family Income Correlation Summary
| Measurement | Cuban | Immigrants from Uzbekistan |
| Minimum | $23,750 | $43,333 |
| Maximum | $131,198 | $184,083 |
| Range | $107,448 | $140,750 |
| Mean | $79,388 | $103,479 |
| Median | $79,353 | $106,438 |
| Interquartile 25% (IQ1) | $67,815 | $80,707 |
| Interquartile 75% (IQ3) | $90,371 | $126,877 |
| Interquartile Range (IQR) | $22,555 | $46,170 |
| Standard Deviation (Sample) | $18,688 | $30,925 |
| Standard Deviation (Population) | $18,601 | $30,729 |
Similar Demographics by Median Family Income
Demographics Similar to Cubans by Median Family Income
In terms of median family income, the demographic groups most similar to Cubans are Honduran ($85,004, a difference of 0.030%), Immigrants from Central America ($85,050, a difference of 0.080%), Choctaw ($84,835, a difference of 0.17%), Haitian ($85,218, a difference of 0.28%), and Immigrants from Bahamas ($84,732, a difference of 0.29%).
| Demographics | Rating | Rank | Median Family Income |
| Paiute | 0.0 /100 | #305 | Tragic $85,414 |
| Immigrants | Dominica | 0.0 /100 | #306 | Tragic $85,411 |
| Chickasaw | 0.0 /100 | #307 | Tragic $85,356 |
| U.S. Virgin Islanders | 0.0 /100 | #308 | Tragic $85,294 |
| Haitians | 0.0 /100 | #309 | Tragic $85,218 |
| Immigrants | Central America | 0.0 /100 | #310 | Tragic $85,050 |
| Hondurans | 0.0 /100 | #311 | Tragic $85,004 |
| Cubans | 0.0 /100 | #312 | Tragic $84,981 |
| Choctaw | 0.0 /100 | #313 | Tragic $84,835 |
| Immigrants | Bahamas | 0.0 /100 | #314 | Tragic $84,732 |
| Apache | 0.0 /100 | #315 | Tragic $84,451 |
| Immigrants | Haiti | 0.0 /100 | #316 | Tragic $84,018 |
| Yakama | 0.0 /100 | #317 | Tragic $83,932 |
| Immigrants | Mexico | 0.0 /100 | #318 | Tragic $83,639 |
| Immigrants | Honduras | 0.0 /100 | #319 | Tragic $83,618 |
Demographics Similar to Immigrants from Uzbekistan by Median Family Income
In terms of median family income, the demographic groups most similar to Immigrants from Uzbekistan are Czechoslovakian ($103,273, a difference of 0.070%), Alsatian ($103,010, a difference of 0.18%), Immigrants from Peru ($103,534, a difference of 0.33%), Immigrants from Eritrea ($102,823, a difference of 0.36%), and Belgian ($102,788, a difference of 0.40%).
| Demographics | Rating | Rank | Median Family Income |
| Costa Ricans | 66.2 /100 | #163 | Good $103,989 |
| Sierra Leoneans | 64.7 /100 | #164 | Good $103,859 |
| Slovaks | 63.1 /100 | #165 | Good $103,729 |
| English | 62.6 /100 | #166 | Good $103,684 |
| South American Indians | 61.9 /100 | #167 | Good $103,624 |
| Immigrants | Peru | 60.8 /100 | #168 | Good $103,534 |
| Czechoslovakians | 57.6 /100 | #169 | Average $103,273 |
| Immigrants | Uzbekistan | 56.6 /100 | #170 | Average $103,197 |
| Alsatians | 54.3 /100 | #171 | Average $103,010 |
| Immigrants | Eritrea | 51.9 /100 | #172 | Average $102,823 |
| Belgians | 51.4 /100 | #173 | Average $102,788 |
| Finns | 50.0 /100 | #174 | Average $102,676 |
| Immigrants | Eastern Africa | 47.1 /100 | #175 | Average $102,451 |
| French | 46.1 /100 | #176 | Average $102,368 |
| Germans | 44.6 /100 | #177 | Average $102,254 |