Cuban vs Immigrants from Taiwan Median Family Income
COMPARE
Cuban
Immigrants from Taiwan
Median Family Income
Median Family Income Comparison
Cubans
Immigrants from Taiwan
$84,981
MEDIAN FAMILY INCOME
0.0/ 100
METRIC RATING
312th/ 347
METRIC RANK
$136,949
MEDIAN FAMILY INCOME
100.0/ 100
METRIC RATING
2nd/ 347
METRIC RANK
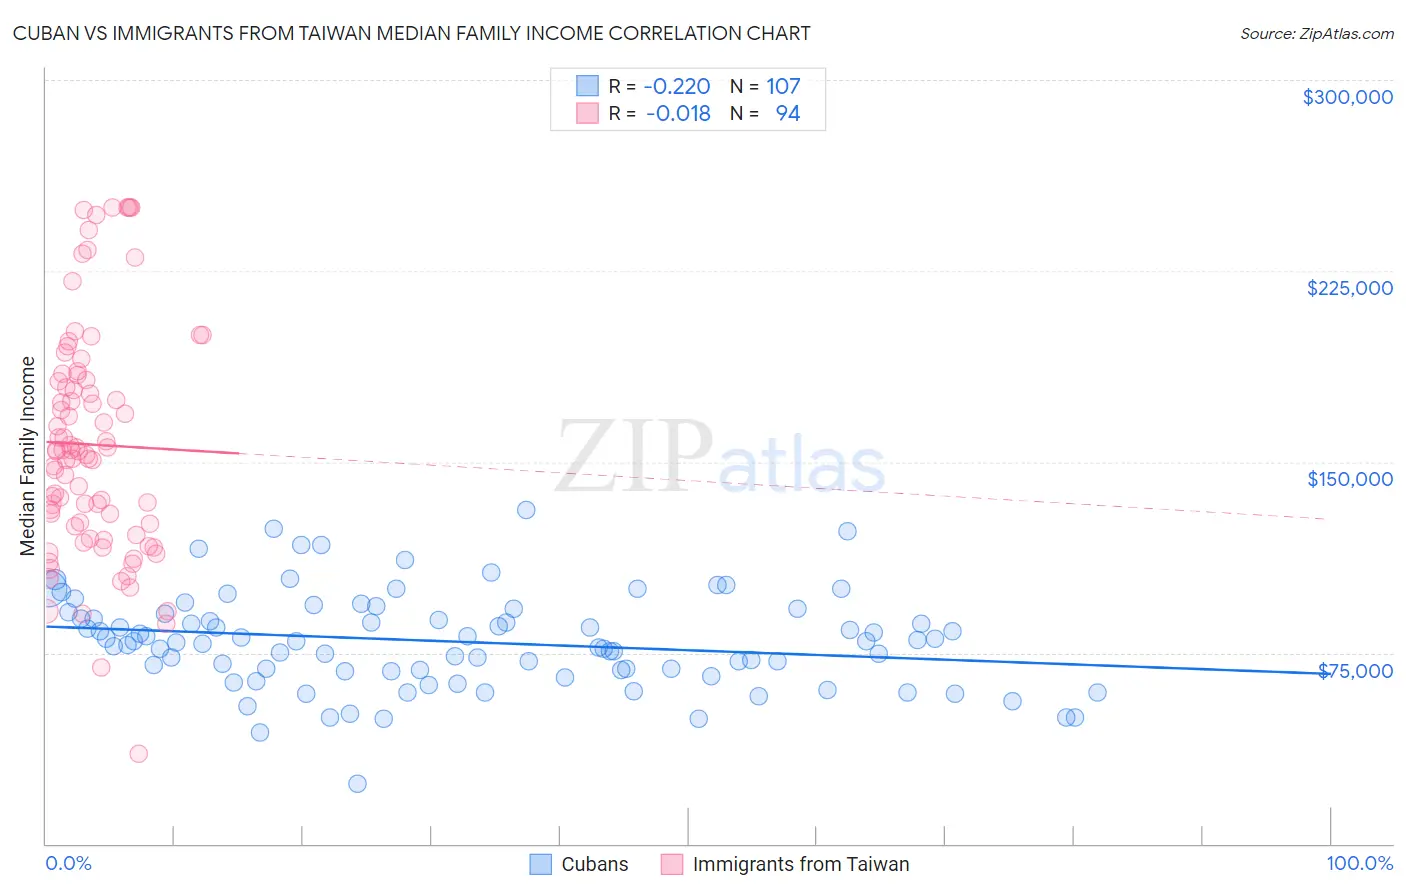
Cuban vs Immigrants from Taiwan Median Family Income Correlation Chart
The statistical analysis conducted on geographies consisting of 448,691,327 people shows a weak negative correlation between the proportion of Cubans and median family income in the United States with a correlation coefficient (R) of -0.220 and weighted average of $84,981. Similarly, the statistical analysis conducted on geographies consisting of 298,070,874 people shows no correlation between the proportion of Immigrants from Taiwan and median family income in the United States with a correlation coefficient (R) of -0.018 and weighted average of $136,949, a difference of 61.2%.
Median Family Income Correlation Summary
| Measurement | Cuban | Immigrants from Taiwan |
| Minimum | $23,750 | $35,382 |
| Maximum | $131,198 | $250,001 |
| Range | $107,448 | $214,619 |
| Mean | $79,388 | $156,781 |
| Median | $79,353 | $154,299 |
| Interquartile 25% (IQ1) | $67,815 | $124,773 |
| Interquartile 75% (IQ3) | $90,371 | $182,305 |
| Interquartile Range (IQR) | $22,555 | $57,532 |
| Standard Deviation (Sample) | $18,688 | $45,464 |
| Standard Deviation (Population) | $18,601 | $45,222 |
Similar Demographics by Median Family Income
Demographics Similar to Cubans by Median Family Income
In terms of median family income, the demographic groups most similar to Cubans are Honduran ($85,004, a difference of 0.030%), Immigrants from Central America ($85,050, a difference of 0.080%), Choctaw ($84,835, a difference of 0.17%), Haitian ($85,218, a difference of 0.28%), and Immigrants from Bahamas ($84,732, a difference of 0.29%).
| Demographics | Rating | Rank | Median Family Income |
| Paiute | 0.0 /100 | #305 | Tragic $85,414 |
| Immigrants | Dominica | 0.0 /100 | #306 | Tragic $85,411 |
| Chickasaw | 0.0 /100 | #307 | Tragic $85,356 |
| U.S. Virgin Islanders | 0.0 /100 | #308 | Tragic $85,294 |
| Haitians | 0.0 /100 | #309 | Tragic $85,218 |
| Immigrants | Central America | 0.0 /100 | #310 | Tragic $85,050 |
| Hondurans | 0.0 /100 | #311 | Tragic $85,004 |
| Cubans | 0.0 /100 | #312 | Tragic $84,981 |
| Choctaw | 0.0 /100 | #313 | Tragic $84,835 |
| Immigrants | Bahamas | 0.0 /100 | #314 | Tragic $84,732 |
| Apache | 0.0 /100 | #315 | Tragic $84,451 |
| Immigrants | Haiti | 0.0 /100 | #316 | Tragic $84,018 |
| Yakama | 0.0 /100 | #317 | Tragic $83,932 |
| Immigrants | Mexico | 0.0 /100 | #318 | Tragic $83,639 |
| Immigrants | Honduras | 0.0 /100 | #319 | Tragic $83,618 |
Demographics Similar to Immigrants from Taiwan by Median Family Income
In terms of median family income, the demographic groups most similar to Immigrants from Taiwan are Filipino ($138,397, a difference of 1.1%), Immigrants from Singapore ($134,818, a difference of 1.6%), Immigrants from India ($134,028, a difference of 2.2%), Iranian ($133,839, a difference of 2.3%), and Thai ($131,281, a difference of 4.3%).
| Demographics | Rating | Rank | Median Family Income |
| Filipinos | 100.0 /100 | #1 | Exceptional $138,397 |
| Immigrants | Taiwan | 100.0 /100 | #2 | Exceptional $136,949 |
| Immigrants | Singapore | 100.0 /100 | #3 | Exceptional $134,818 |
| Immigrants | India | 100.0 /100 | #4 | Exceptional $134,028 |
| Iranians | 100.0 /100 | #5 | Exceptional $133,839 |
| Thais | 100.0 /100 | #6 | Exceptional $131,281 |
| Immigrants | Hong Kong | 100.0 /100 | #7 | Exceptional $131,067 |
| Immigrants | Iran | 100.0 /100 | #8 | Exceptional $130,894 |
| Okinawans | 100.0 /100 | #9 | Exceptional $129,979 |
| Immigrants | Ireland | 100.0 /100 | #10 | Exceptional $127,584 |
| Immigrants | Israel | 100.0 /100 | #11 | Exceptional $127,430 |
| Cypriots | 100.0 /100 | #12 | Exceptional $127,064 |
| Immigrants | Australia | 100.0 /100 | #13 | Exceptional $126,620 |
| Immigrants | South Central Asia | 100.0 /100 | #14 | Exceptional $125,956 |
| Eastern Europeans | 100.0 /100 | #15 | Exceptional $125,546 |